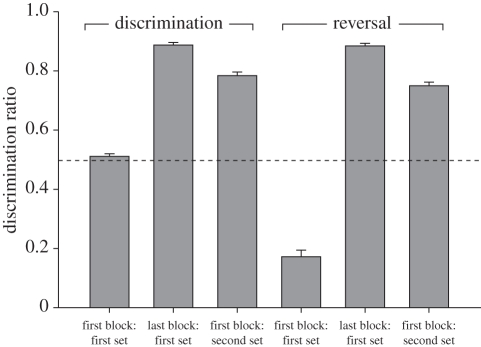
Figure 1.
The mean ± s.e.m. for the DR (y-axis) of all birds (n = 27) during various stages of training (x-axis). Each block consisted of 500 trials. Out of 40 total stimuli, the first set contained 10 exemplars of each note, the second set contained the remaining exemplars. During discrimination training, all birds were rewarded for responding to B notes, and not rewarded for C notes, while during reversal training, birds were rewarded for responding to C notes, and not rewarded for B notes. Chance discrimination is indicated by the dashed line.

