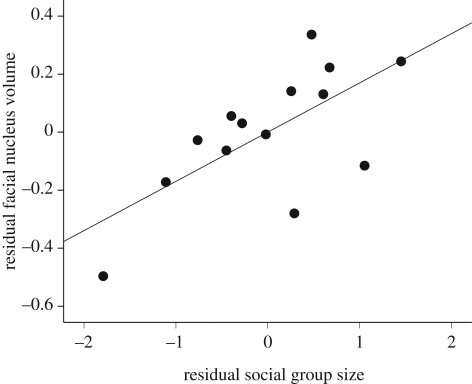
Figure 1.
Scatter plot depicting the positive correlation between facial nucleus volume and group size after controlling for medulla volume in catarrhines (n = 14). Values are unstandardized residuals from ordinary least squares (OLS) regression with medulla volume as the independent variable. Trend line is an OLS fit.

