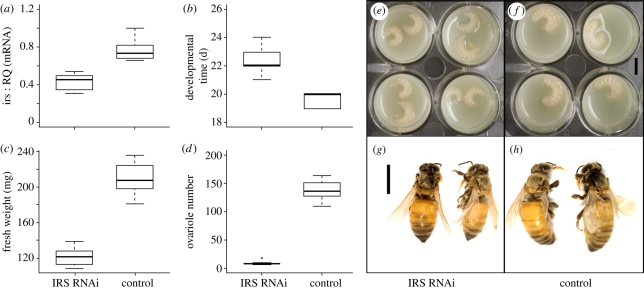
Figure 1.
Physiological characters differ between irs knockdowns and control honeybees. (a) irs expression, (b) developmental time, (c) fresh weight and (d) ovariole number. Boxplots show medians and 25–75 percentiles. All traits diverged between groups (Mann Whitney U-tests, p < 7.4E − 07). (e,f) Images of representative individuals in early 5th larval instar and (g,h) as newly emerged adults visualize the phenotypic differences (scale bar, 0.5 cm).

