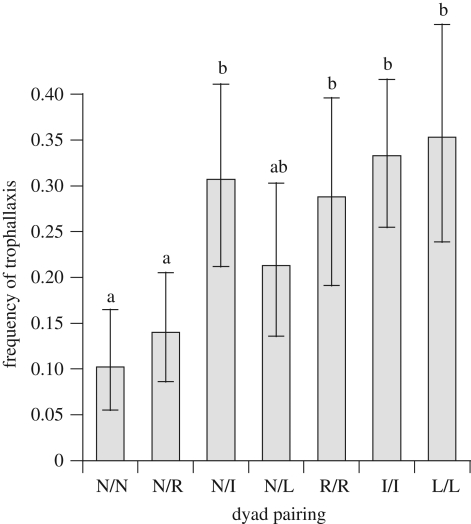
Figure 1.
Back-transformed mean frequency of trophallactic exchanges and 95% CI pooled from four colonies after 24 h of isolation. Pairs (three per colony for each pairing) include naive workers (N), workers injected with Ringer solution (R), workers injected with heat-killed S. marcescens (I) and workers injected with LPS (L). Different letters indicate significant pairwise differences (Tukey's HSD, p < 0.05).

