Figure 2.

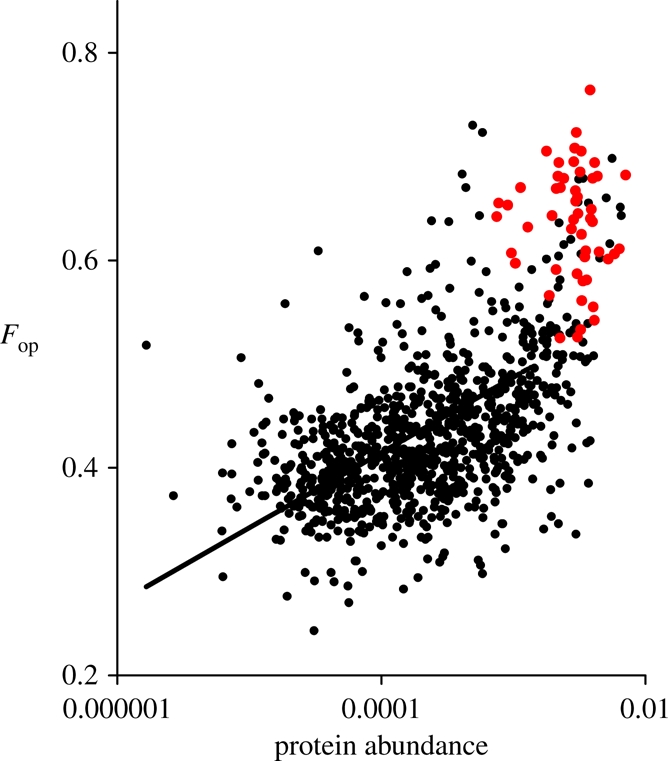
The frequency of optimal codons in a gene (Fop) as a function of gene expression level, as estimated from protein abundance data (from [14]). The subset of 51 HE genes is shown in red.

The frequency of optimal codons in a gene (Fop) as a function of gene expression level, as estimated from protein abundance data (from [14]). The subset of 51 HE genes is shown in red.