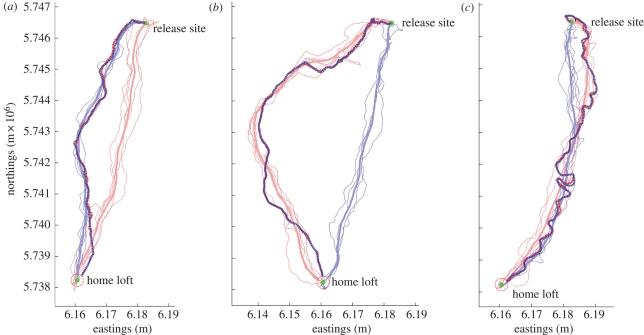
Figure 2.
Examples of three different pairings. Each panel shows the training tracks (thin, solid lines), calculated mean paths (thick, solid lines) and paired tracks (thick, dashed bold line) for both birds of the pair (red and blue). Two correctly predicted pairings (a and b) and one incorrectly predicted pair (c) using the 5% peak fidelity measure are shown.

