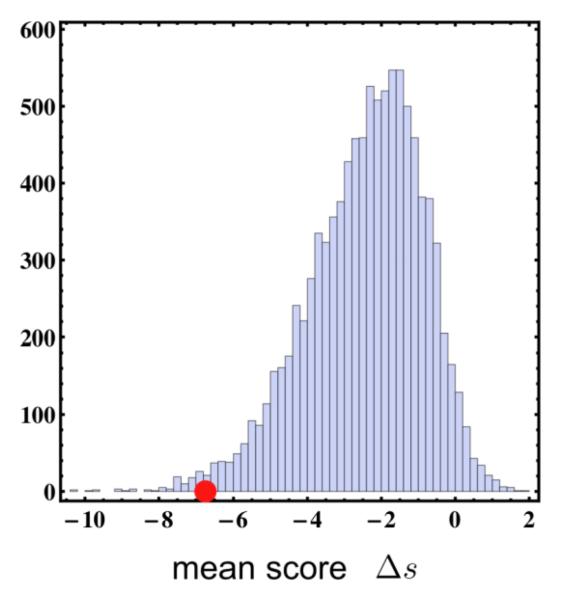
Figure 2. Analysis of PBRM1 missense mutations.
Bars represent histogram of the mean score of in silico generated random missense mutations (10,000 sets of three mutations that can be scored) and the red circle denotes the mean score of the somatic mutations that could be scored (T232P □s = −7.78, A597D □s = −9.69, H1204P □s = −2.76). The somatic set is significantly different from the null set (p-value 0.01). They have a higher negative mean score and are thus predicted to be more deleterious on average.

