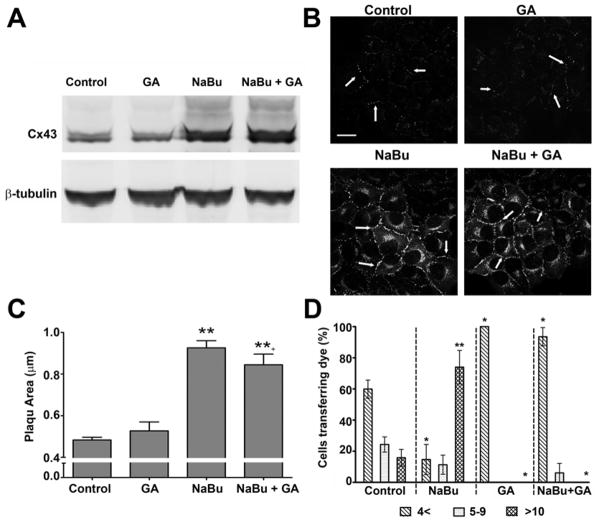
Figure 1. Cx43 expression and function in HeLa-43 cells following exposure to NaBu and/or GA.
Representative Western blots from HeLa-43 cells demonstrate alterations in Cx43 protein expression following 24 h treatments (as labelled) with β-tubulin used for loading controls (A). In B representative immunofluorescent images show Cx43 expression and sub-cellular localization in HeLa-43 cells following treatments (as labelled). Arrows indicate GJ plaques, bar = 20 μm and are representative for all panels. Differences between the total size of GJ plaques following treatments were assessed using Metamorph software (C). In D dye transfer in HeLa-43 cells was measured following treatments (as indicated). HeLa-43 cells were microinjected with Alexa 594, data are expressed as the percentage (of total cells) transferring dye to: 0–4; 5–9; >10 neighbouring cells (n=3, with ~50 cells injected per sitting). Data of the mean ±SE were analysed for significance compared to controls *=p<0.05, **=p<0.01.

