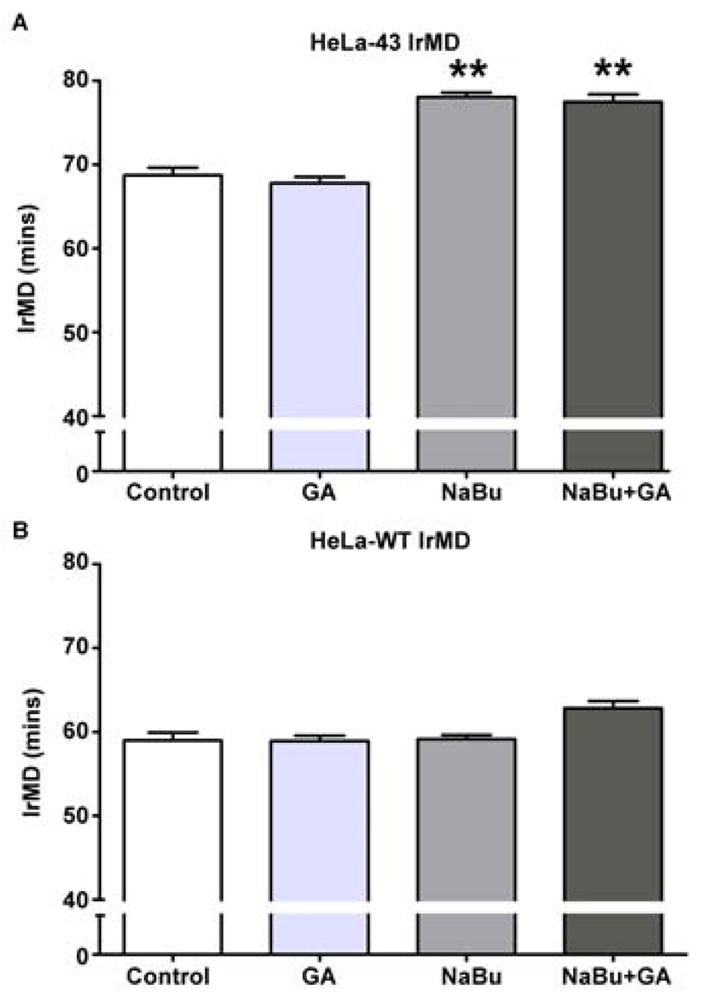
Figure 3. Mean IrMD of HeLa-43 and HeLa-WT cells following treatment with NaBu and or GA.

HeLa-43 (A) and HeLa-WT (B) cells treated with NaBu and/ or GA were analysed by 24 h timelapse microscopy. Data of the mean IrMD ±SE for each treatment were analysed for significance as compared to controls (A, B). In each experiment **=p<0.01, n=3 for all treatments.
