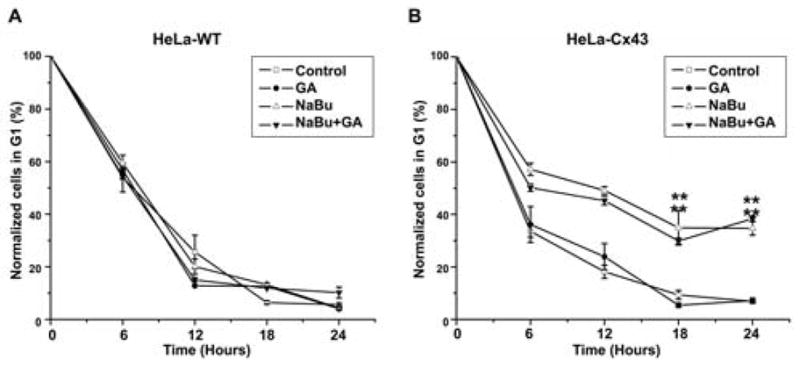
Figure 4. Cell cycle analysis in HeLa-43 and HeLa-WT cells.

Cell cycle was assessed using flow cytometry of cells treated with NaBu and/ or GA and co-incubated with colcemid. Data of percentage cells (±SE) in G1 at specified timepoints were plotted for each treatment in HeLa-WT cells (A) and HeLa-43 (B).
