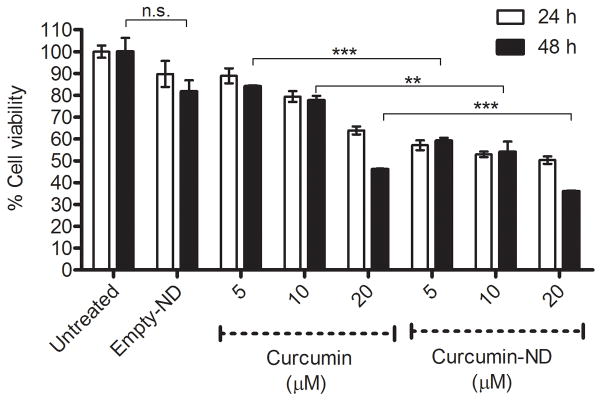
Figure 5. Effect of curcumin on HepG2 cell growth.
Cells were incubated with specified concentrations of free curcumin (in DMSO) or curcumin-ND for 24 and 48 h. Percent cell viability, relative to untreated cells, was measured by MTT assay. Values are reported as mean ± S.D. (n=4). At both time-points, for all three concentrations tested, the difference between curcumin-ND and free curcumin was statistically significant. Differences between groups for the 48 h time point are shown in the figure. **P<0.01; *** P<0.001; n.s. not significant.

