Fig. 6.
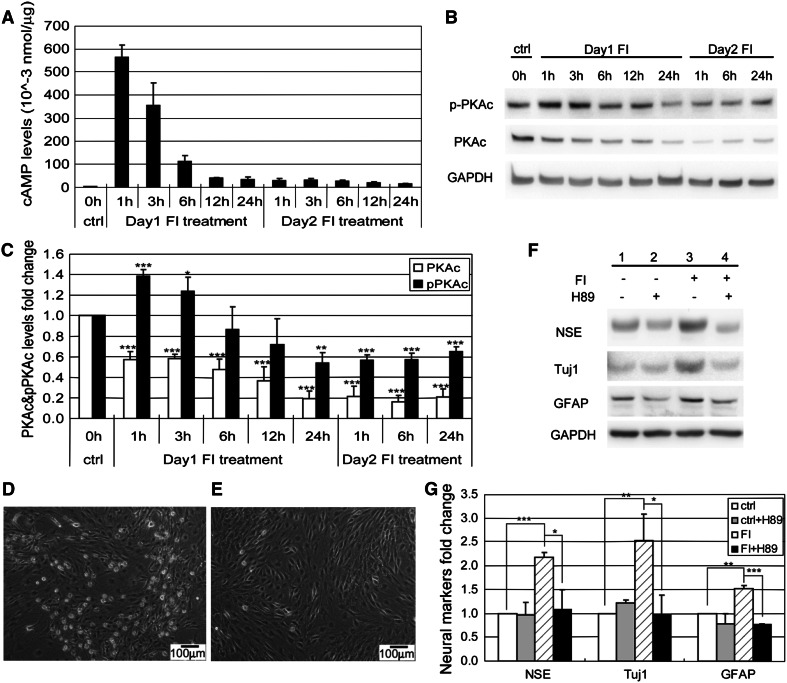
PKA regulates both morphology changes and neural markers expressions. a Intracellular cAMP levels of control MSCs, MSCs induced with 10 μM forskolin, and 100 μM IBMX (FI) for 1, 3, 6, 12, and 24 h (Day 1), and MSCs induced again with FI for 1, 3, 6, 12, and 24 h, following a 24-h FI induction period (day 2) (n = 3). b Western blotting results of PKAc and pPKAc levels of control MSCs, MSCs induced with FI for 1, 3, 6, 12, and 24 h, and MSCs induced with FI for 1, 6, and 24 h following a 24-h FI induction period. c Quantification of PKAc and threonine 197 phosphorylated PKAc (pPKAc) levels as in (b) (n = 4). *p < 0.05, **p < 0.01, ***p < 0.001 as compared with the corresponding control condition. d Phase-contrast image of MSCs induced with FI for 1 h. e Phase-contrast image of MSCs induced with FI in the presence of 2.5 μM PKA inhibitor H89 for 1 h. f Expression of neural markers, NSE, Tuj1, and GFAP, in control MSCs, MSCs induced with 10 μM forskolin and 100 μM IBMX (FI) for 1 day in the absence or presence of 2.5 μM PKA inhibitor H89. g Quantification of Western-blot results as shown in (a) (n = 3). *p < 0.05, **p < 0.01, ***p < 0.001

