
Fig. 2.
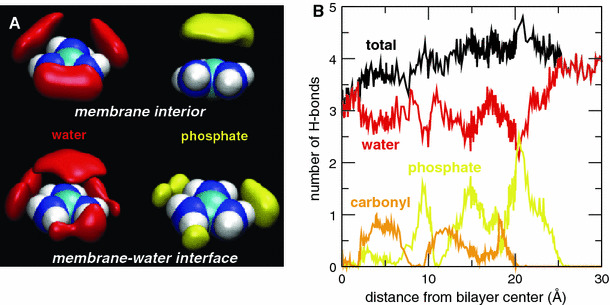
a Predominant solvation shell structure of the Gdm ion represented by surfaces of equal number density for water O (red, 0.033 Å−3) and lipid phosphate O (yellow, 0.009 Å−3). The upper row corresponds to the ion in the interior of the membrane (0.0 ≤ |z| ≤ 2.5 Å), and the lower row to the region of the membrane–water interface (19.5 ≤ |z| ≤ 21.5 Å). b Average number of H-bonds formed by the Gdm ion with water molecules (red), lipid phosphate (yellow), and carbonyl groups (orange) as a function of the ion center of mass position. At any given instant of time, the Gdm ion forms 3–4 H bonds with water and/or lipid polar groups (Color figure online)