
Fig. 8.
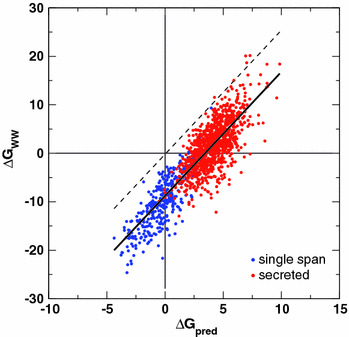
Correlation of free energies of insertion, ΔG pred, from a biological hydrophobicity scale including position dependence (Hessa et al. 2007) with predictions, ΔG WW, derived from the Wimley–White whole-residue octanol hydrophobicity scale (White and Wimley 1999) for single-span TM helices (blue dots) and proteins known to be secreted (red dots). The thick solid line is the fit through the points described by ΔG WW = −8.79 + 2.56ΔG pred (kcal mol−1). The dashed line is the fitted line shifted upward by 8.79 kcal mol−1 (Color figure online)