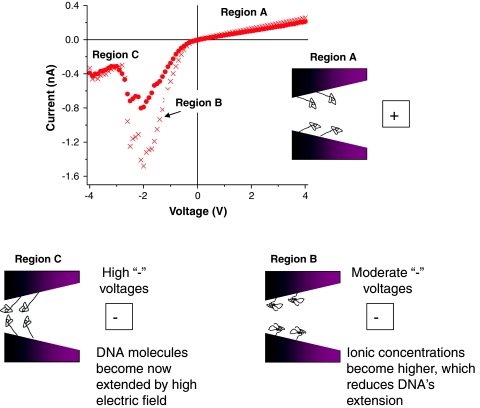
Fig. 4.
Two current–voltage curves (the same as shown in Fig. 3d) for an 8-nm-diameter nanopore modified with DNA, recorded when the voltage was changed from +4 to −4 V. Insets schematically indicate possible configurations of the attached DNA molecules as a function of applied voltage

