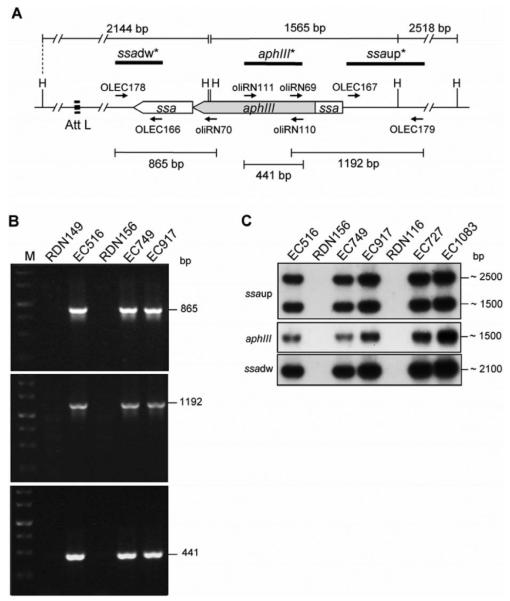
Figure 3.
Analysis of the broad host range of recombinant phage  149::Kmr. A, Representative restriction map of the att-L proximal region of
  149::Kmr. Genes are drawn to scale. Small, black arrows, positions of primers. Sizes of PCR and hybridizing restriction fragments are indicated in bp. B, Results of polymerase chain reaction analysis of genomic DNA from
  149 donor strain RDN149,
  149::Kmr donor strain EC516, recipient strain RDN156 (M28), and lysogenized strains EC749 and EC917, with primers OLEC178 and oliRN70 (top), oliRN69 and OLEC179 (middle), and oliRN111 and oliRN110 (bottom). M, 1-kb DNA ladder (Fermentas Life Sciences). C, Results of Southern blot analysis of HindIII-digested genomic DNA from
  149::Kmr donor strain EC516, phage recipient strain RDN156 (M28) and corresponding lysogenized strains EC749 and EC917, phage recipient strain RDN116 (M94) and corresponding lysogenized strains EC727 and EC1083 with α-32P labelled DNA probes specific to the ssa upstream fragment (ssaup), aphIII gene, and ssa downstream fragment (ssadw).

