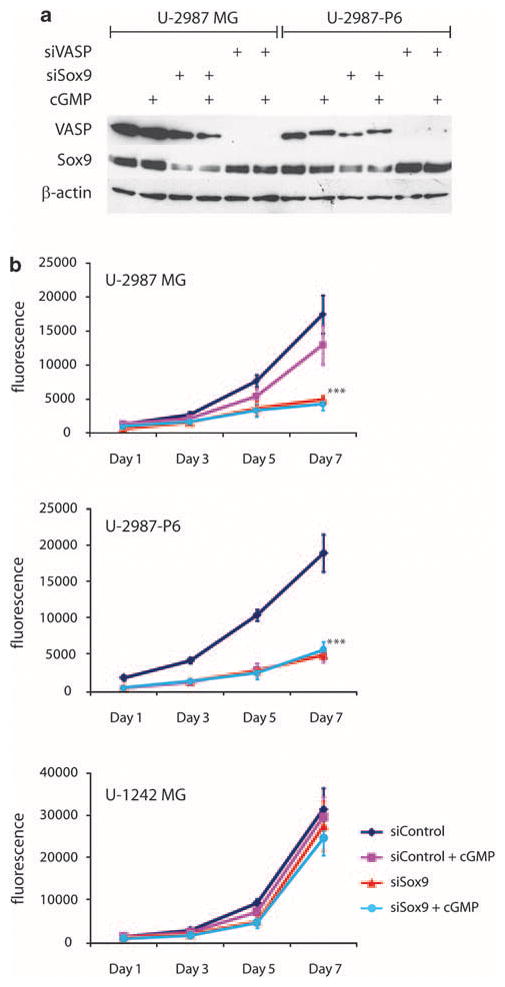
Figure 6.

(a) Western blot of U-2987MG and U-2987-P6 after siRNA inhibition of VASP (siVASP) and Sox9 (siSox9) with or without stimulation with 250 μM of 8-pCPT-cGMP for 8 h. (b) Cell proliferation of glioma cell lines (U-2987MG, U-2987-P6 and U-1242MG) transfected with control siRNA-A (siControl) or siRNA directed against Sox9 (siSox9). Fluorescence (measurement of cellular DNA content) proportional to cell number after 1, 3, 5 and 7 days of culturing after siRNA transfection is presented (from quadruplicate CyQUANT measurements). Statistical significance: ***P<0.001, using Student’s unpaired t-test (error bars indicate standard deviation from quadruplicates for siSox9 and siSox9 (+cGMP) compared with siControl for both U-2987MG and U-2987-P6 and also for siControl+cGMP compared with siControl for U-2987-P6).
