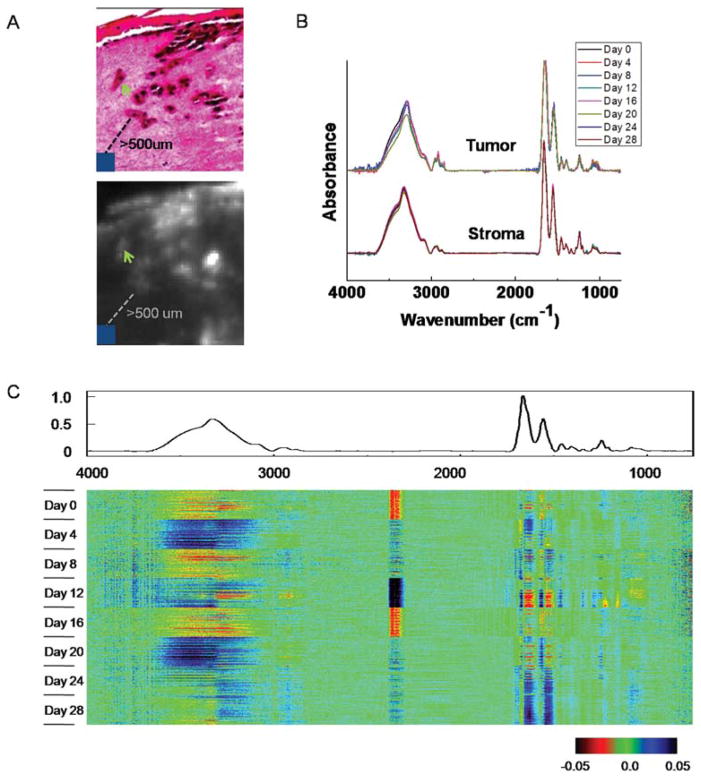
Fig. 3.
Temporal analysis of tumor and normal stroma. (A) Spectra of 10 pixels of tumors (green arrow) and 10 × 10 pixels of normal stroma that are at least 500 μm away from tumors (blue square) are extracted for temporal analysis. (B) Comparison of average spectra from tumor and normal stroma regions. (C) CDM visualization of spectra of normal stroma. The average spectrum is shown above the data and the central data block displays the difference of each pixel spectrum from the average spectrum.

