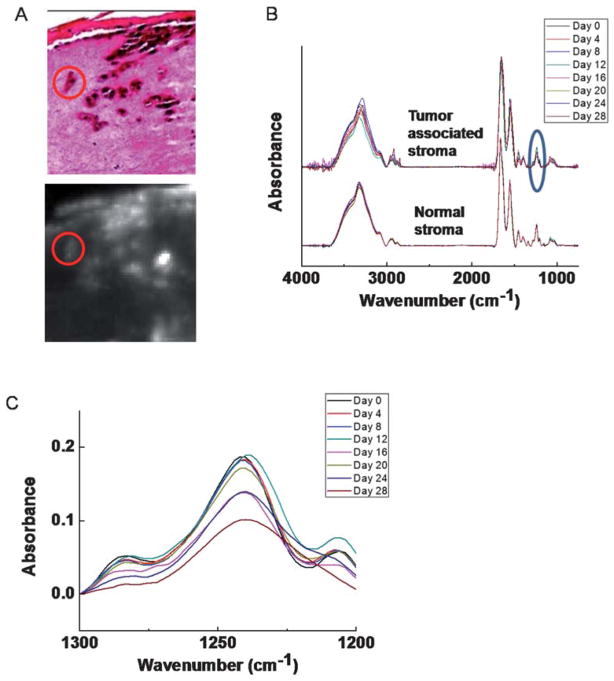
Fig. 4.
Temporal behavior of normal and tumor-associated stroma. (A) Spectral regions of tumor (red circle) and tumor associated stroma are extracted for analysis of temporal changes. (B) Spectral analysis of normal and tumor-associated stroma demonstrates likely differences between the two, especially including significant changes in the 1200–1300 cm−1 (blue circle) region. (C) Spectral detail of the 1200–1300 cm−1 region indicates that the biochemical changes likely occur around day 16.

