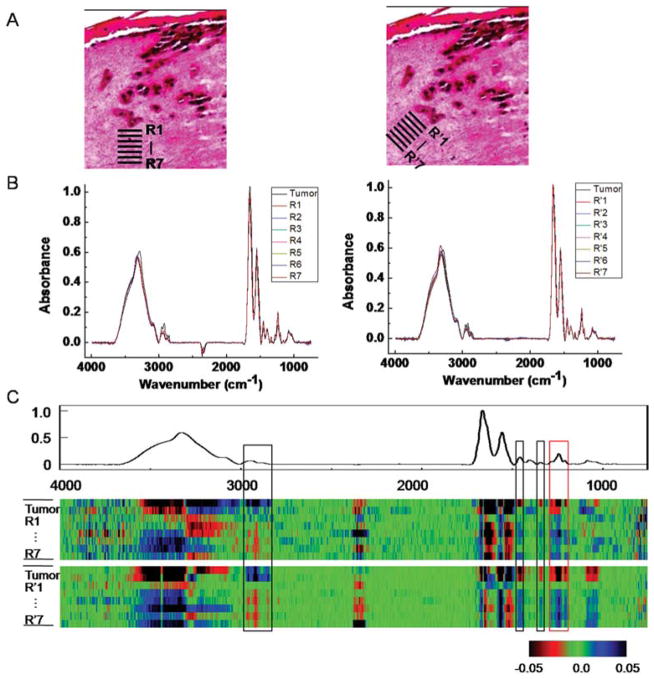
Fig. 5.
Analysis of stromal transformation around a tumor. (A) Spectra at tumor-neighboring dermal region at different depths and angles (R1–R7, R′1–R′7) are extracted. (B) Analysis of ROIs from the tumor and 7 peritumoral regions at both angles shows spectral differences. (C) CDM suggests a transition pattern of spectra from tumor to distal stromal regions at a few spectral peaks (highlighted by boxes in the picture), including a prominent peak 1200–1300 cm−1 (red box). A sample from day 20 is used for the analysis.

