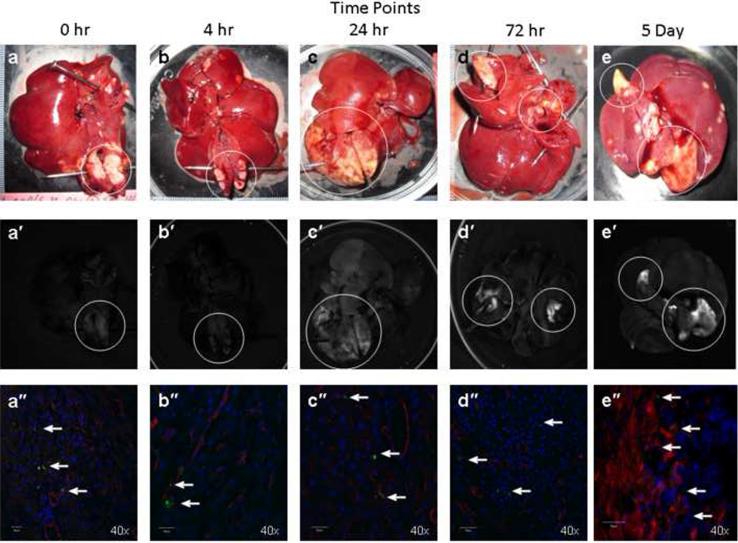
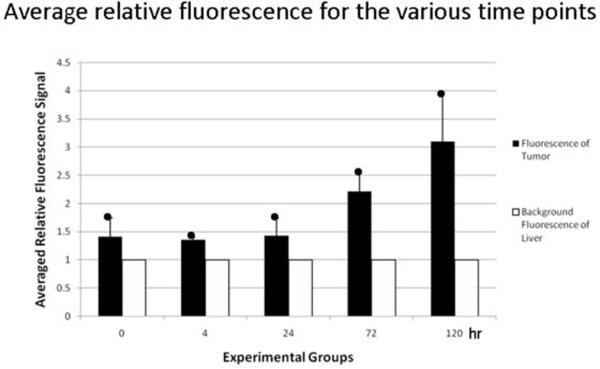
Figure 5. In vivo hepatic infusions with Eu-G3P4A18N over several time points with analysis of the tumor luminescence.
(A) Gross photographs of the livers containing tumors (circles) that were injected in the spleen 15 – 20 days prior to infusion of Eu-G3P4A18N and excised at 0 h, 4 h, 24 h, 72 h and 5 day time points (a – e). Images (a′ – e′) were from the same liver and tumor tissue and same hepatic infusions with Eu-G3P4A18N under fluorescence imaging displaying grossly the tumor luminescence. 40× magnifications of confocal microscopic images (a″ – e″) were also obtained from the same liver and tumor tissue and same corresponding time points displaying luminescence signaling in all time points (arrows). (B) Average signals obtained from the tumors were compared to that of tissue autofluorescence and displayed in the resulting graph. Two rats per each experimental group were used.


