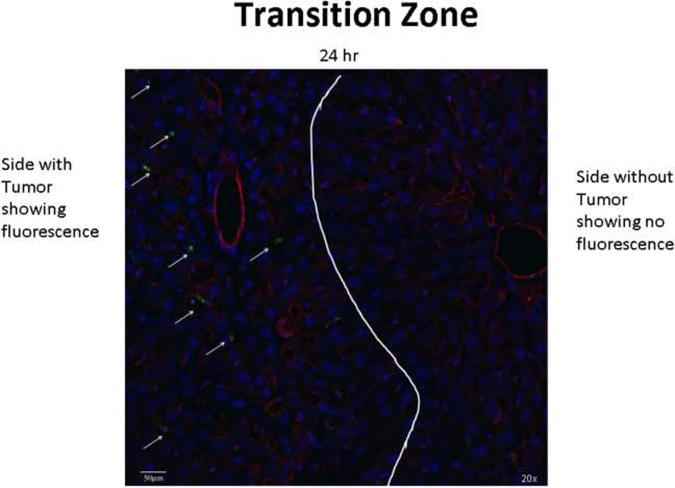
Figure 6. Transition zone between normal liver and tumor.
A 20× confocal microscopic image of a rat liver containing a metastatic tumor which was infused with Eu-G3P4A18N and then the liver was excised 24 h later. The transition zone between the healthy normal liver (right of the white line) and the tumor (left of the white line) is seen. The arrows point to the green luminescence given off from the Eu-G3P4A18N itself and it is not seen on the healthy liver side.

