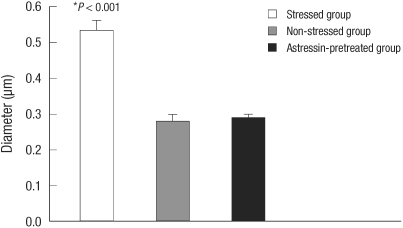
Fig. 2.
Comparison of intercellular space diameters in esophageal mucosa. The mean intercellular space diameter in the saline-pretreated stressed group is significantly greater than in the non-stressed group (*P < 0.001). The mean intercellular space diameter in the astressin-pretreated stressed group is significantly lower than in the stressed group. The mean intercellular space diameters in the non-stressed and astressin-pretreated stressed groups are similar.

