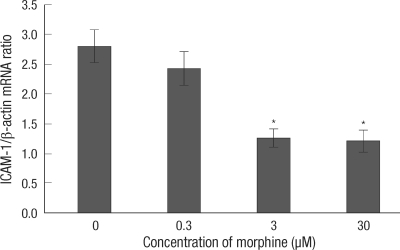
Fig. 4.
Attenuation of the ICAM-1 mRNA level in the HUVEC cells by MPostC. qRT-PCR was performed to measure the ICAM-1 mRNA levels with using SYBR Premix Ex Taq. The relative gene expression levels were calculated as ratios by using β-actin for normalization. The value of the 0 hr control was baseline and it was calculated as a ratio of 1, and the others were recalculated as ratios relevant to a ratio of 1. All the values were compared to the value of the control group at 6 hr reoxygenation. The values are the mean ± SD of 6 experiments. *P < 0.05.

