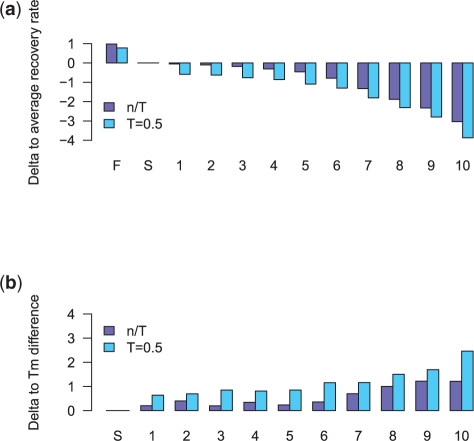
Fig. 4.
Dataset MZ44-1: (a) Average change of total recovery rates across all species for different sets of input trees: gene tree (F); reference species tree (S); (1–10) bins with trees estimated from other genomic loci; increasing bin number corresponds to higher topological distance to reference tree. (b) Change in the Tm difference due to increased number of mismatches in the primer sequence.

