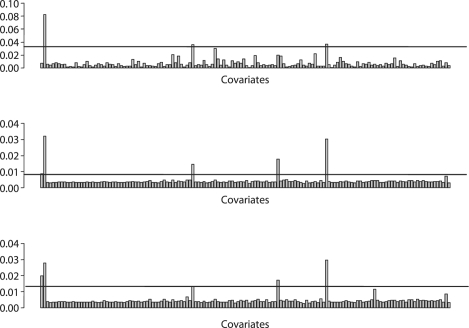
Fig. 1.
Posterior probability of a variable appearing in the CPH-TREE (top), WEI-TREE (center) and AFT-TREE (bottom) survival ensemble methods as applied to the brain tumor data. Variables with posterior probability above the horizontal gray line are considered to be significantly used; controlled by 10% FDR. High-resolution version of this figure can be viewed in the supplementary materials.

