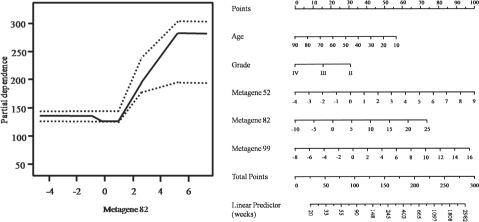
Fig. 2.
Marginal effects of significant covariates. Left panel: partial dependence function plots for metagene 82 with y-axis in weeks. Right panel: nomogram of the most important variables in the AFT-TREE model. High-resolution version of this figure can be viewed in the supplementary materials.

