
Fig. 2.
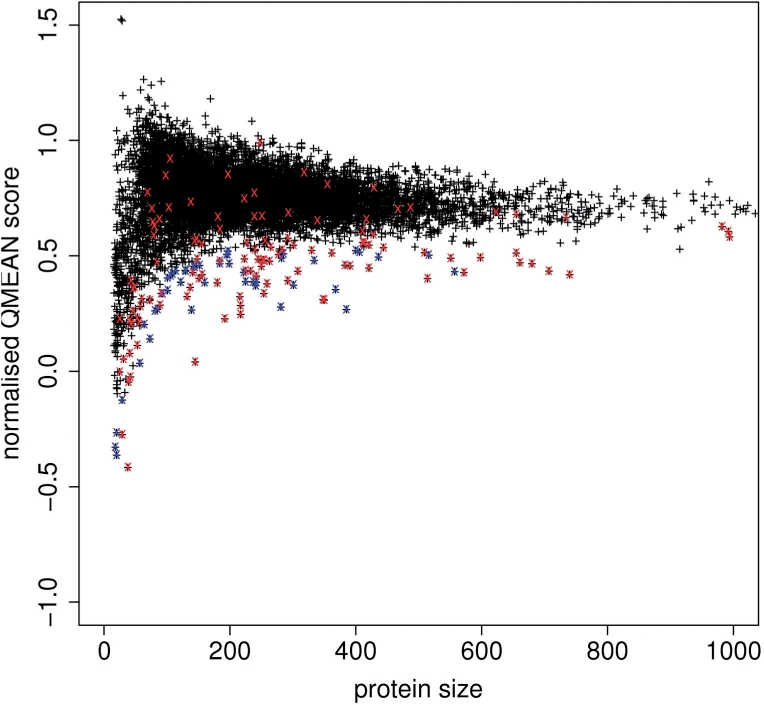
Normalized QMEAN score composed of four statistical potential terms (QMEAN4) of 9766 high-resolution structures. Red crosses indicate chains belonging to membrane proteins, blue crosses denote other proteins deviating by more than 3 standard deviations (see Supplementary Table S1 for details).