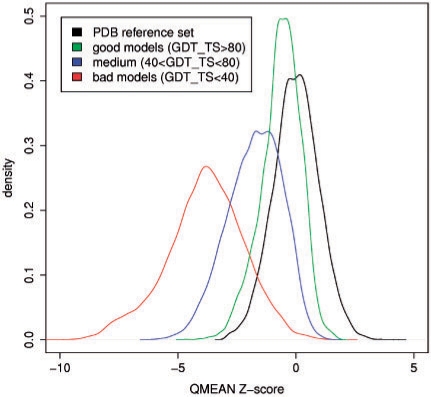
Fig. 6.
Density plot visualizing the QMEAN Z-score distribution of theoretical protein structure models. Z-scores for models from CASP8 are shown in relation to scores of experimental reference structures (black line). The models are split into three quality ranges with low-quality models in red, medium-quality models in blue and good models in green.

