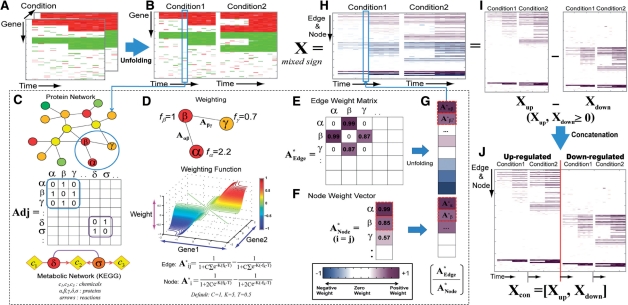
Fig. 1.
Construction of an activation weight matrix. PNA first transforms multi-dimensional expression data into log2-fold changes (A) and unfolds it into a two-dimensional matrix (B). We then represent the edges with the adjacency matrix Adj (C). Using a weighting function (D), the PNA then computes both edge (A*Edge) and node (A*Node) activity weights (E and F), unfolds the A*Edge into a vector and concatenates it with A*Node, resulting in a weight vector for each condition (G and H). For the ONMF analysis, we represented the activity weight matrix (X) with X = Xup−Xdown (I) and then concatenated Xup and Xdown to result in Xcon = [Xup, Xdown] (J).

