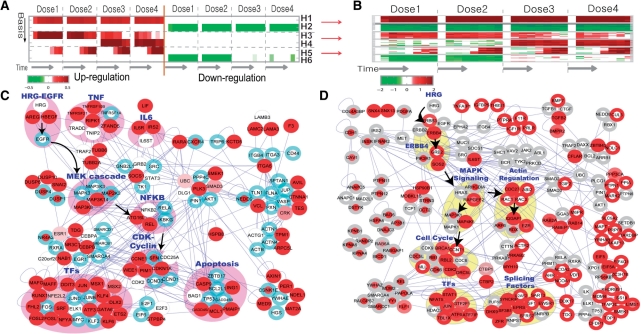
Fig. 3.
Application of PNA to the gene expression data from HRG-treated MCF cells. ONMF captured six activation patterns in the data (A). Differential expression of the top 20 genes is well-correlated with the activation patterns in A (B). To investigate HRG dose dependent dynamics, we reconstructed the PS for H5 (HRG dose-dependent activation) using the selected nodes (red) and edges (C). The blue boundary indicates that the corresponding node also belongs to PS1. We then explored the interactions between two PSs for H6 (low-dose specific down-regulation; red nodes) and H4 (high-dose specific up-regulation; red boundary) (D). See the text for details.

