Figure 1.

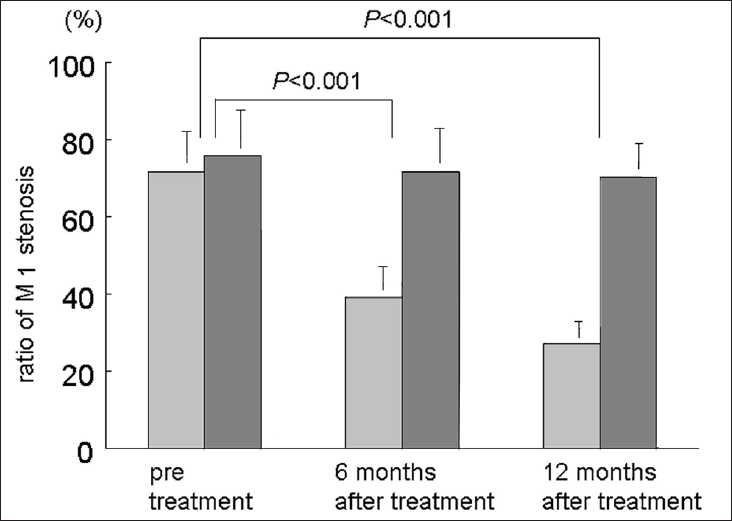
Burr graph demonstrating changes in M1 stenosis before, and 6 and 12 months after cilostazol treatment. Light and dark bars show the suspected mean ratio of M1 stenosis in 5 responders and 14 non-responders.

Burr graph demonstrating changes in M1 stenosis before, and 6 and 12 months after cilostazol treatment. Light and dark bars show the suspected mean ratio of M1 stenosis in 5 responders and 14 non-responders.