
Figure 2.
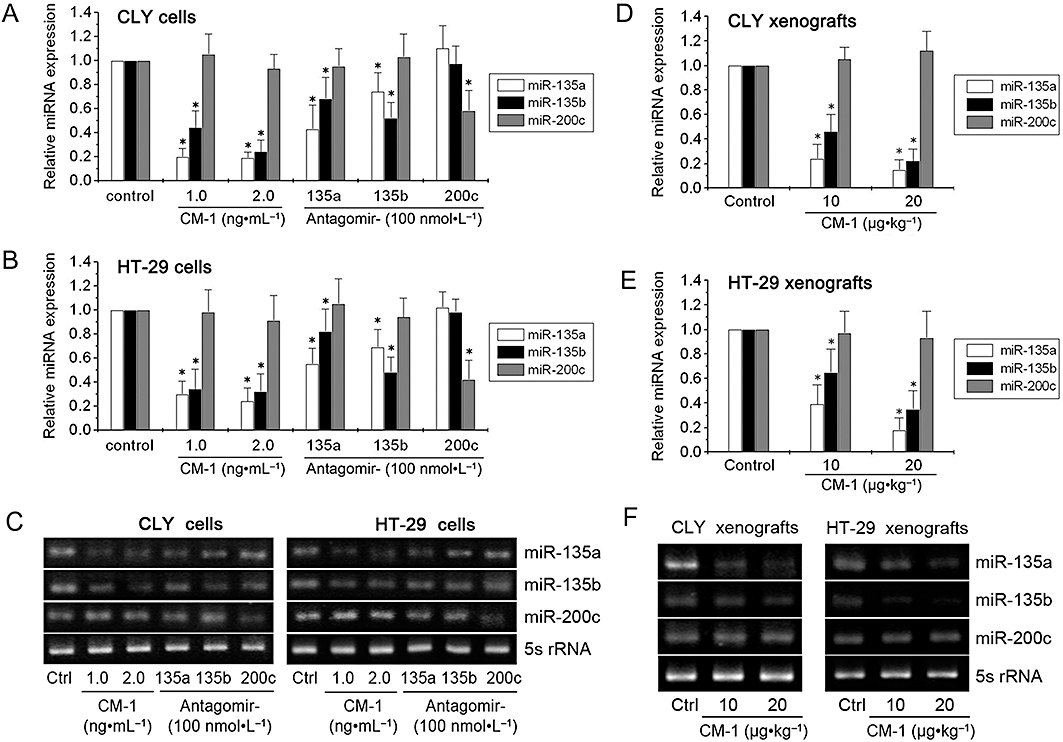
Down-regulation by CM-1 of miR-135a&b. qRT-PCR analysis of miR-135a, miR-135b and miR-200c (as a negative control) in CLY (A) and HT-29 (B) cells treated with PBS, CM-1, antagomir-135a, antagomir-135b, or antagomir-200c. qRT-PCR analysis of miR-135a, miR-135b and miR-200c (as a negative control) in CLY (D) and HT-29 (E) tumour xenografts from nude mice treated with PBS or CM-1. In panels A, B, D and E, data shown are means from three independent experiments after normalization to the internal control 5s rRNA. *P < 0.05, significantly different from the respective controls; one-way analysis of variance with Tukey's post hoc test. (C and F) Electrophoresis of the PCR products was performed to check PCR specificity.