
Figure 5.
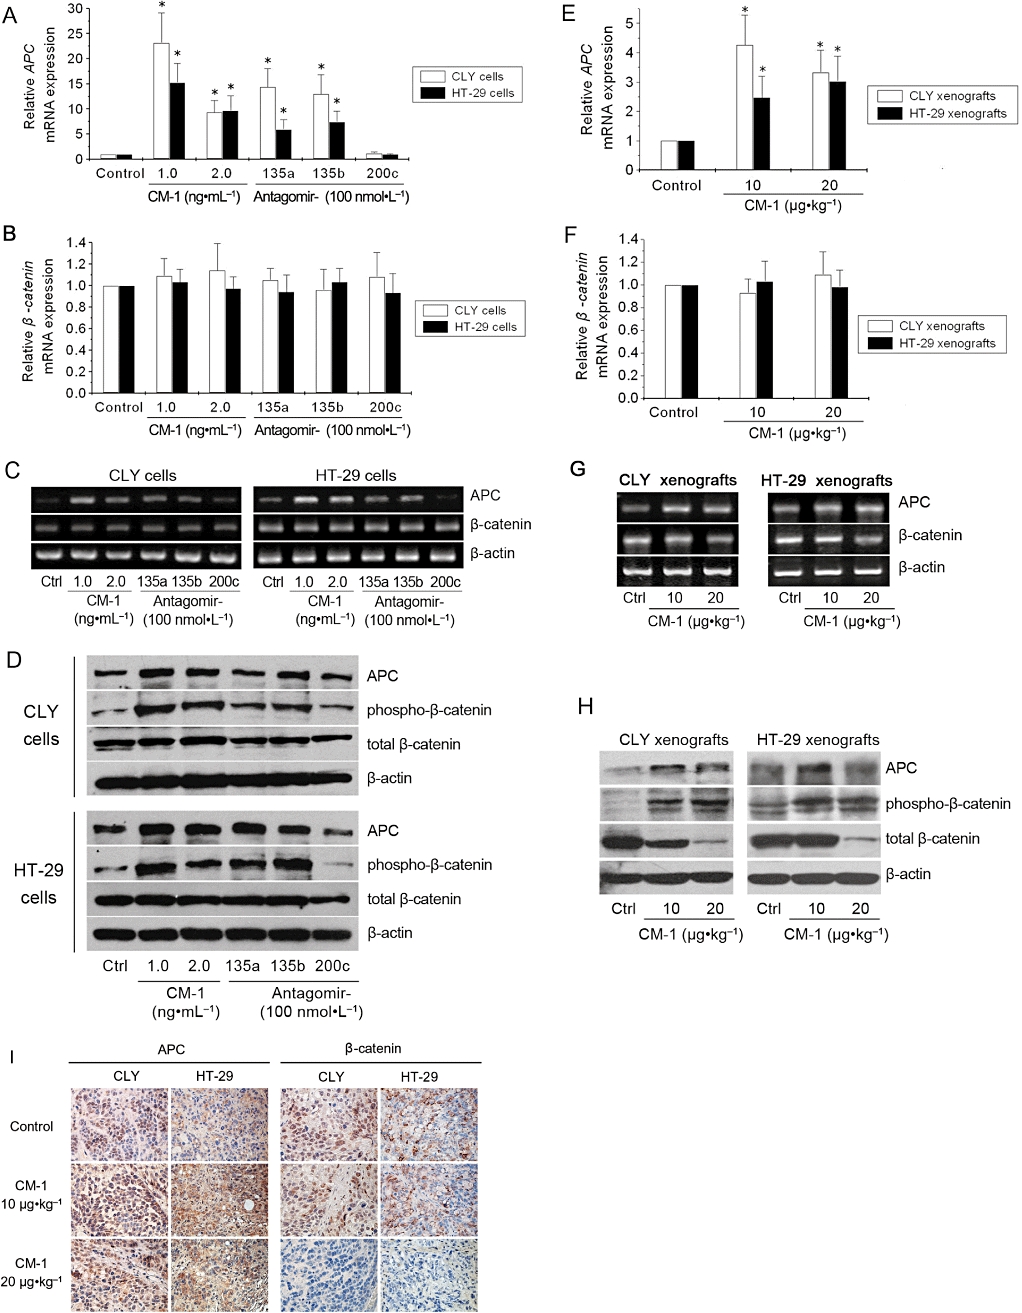
CM-1 upregulated adenomatous polyposis coli (APC) expression and β-catenin phosphorylation. qRT-PCR analysis of APC and β-catenin mRNA levels in CLY (A) and HT-29 (B) cells treated with PBS, CM-1, antagomir-135a, antagomir-135b, or antagomir-200c. qRT-PCR analysis of APC and β-catenin mRNA levels in CLY (E) and HT-29 (F) tumour xenografts from nude mice treated with PBS or CM-1. In panels A, B, E and F, data shown are means from three independent experiments after normalization to the internal control β-actin. *P < 0.05, significantly different from the respective controls; one-way analysis of variance with Tukey's post hoc test. (C and G) Electrophoresis of the PCR products was performed to check PCR specificity. (D) Western blot analysis of APC, phospho-β-catenin and total β-catenin protein levels in CLY and HT-29 cells treated with PBS, CM-1, antagomir-135a, antagomir-135b, or antagomir-200c. (H) Western blot analysis of APC, phospho-β-catenin and total β-catenin protein levels in CLY and HT-29 tumour xenografts from nude mice treated with PBS or CM-1. In panels D and H, β-actin was used as the internal control for normalization and data shown are representative of three independent experiments. (I) Immunohistochemical analysis of APC and β-catenin in CLY and HT-29 tumour xenografts (original magnification, ×220).