
Figure 6.
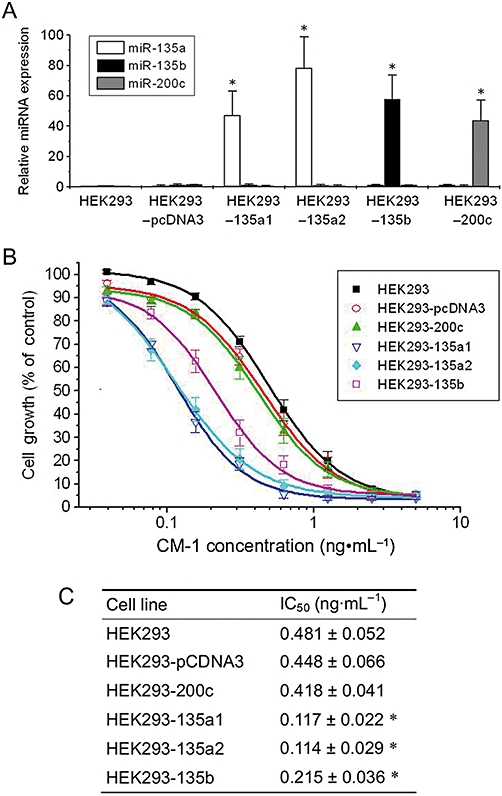
Effects of miR-135a&b expression levels on CM-1 cytotoxicity in HEK293 cells. (A) By stable transfection of expression plasmid DNA (pCDNA3, pCDNA3-miR-135a1, pCDNA3-miR-135a2, pCDNA3-miR-135b or pCDNA3-miR-200c) and clonal selection, HEK293 cell lines with high levels of miR-135a, miR-135b or miR-200c expression were generated and analysed by qRT-PCR analysis. Data shown are means from three independent experiments after normalization to the internal control 5s rRNA. *P < 0.05, significantly different from the respective controls; one-way analysis of variance with Tukey's post hoc test. (B and C) These derivative cell lines, as well as control HEK293 cells, were treated with graded concentrations of CM-1 for 96 h and then cell viability was examined by MTT assay. Experiments performed in triplicate IC50 values were determined by non-linear regression with dose-response curve fitting. *P < 0.05, significantly different from the values for HEK293 cells; one-way analysis of variance with Tukey's post hoc test.