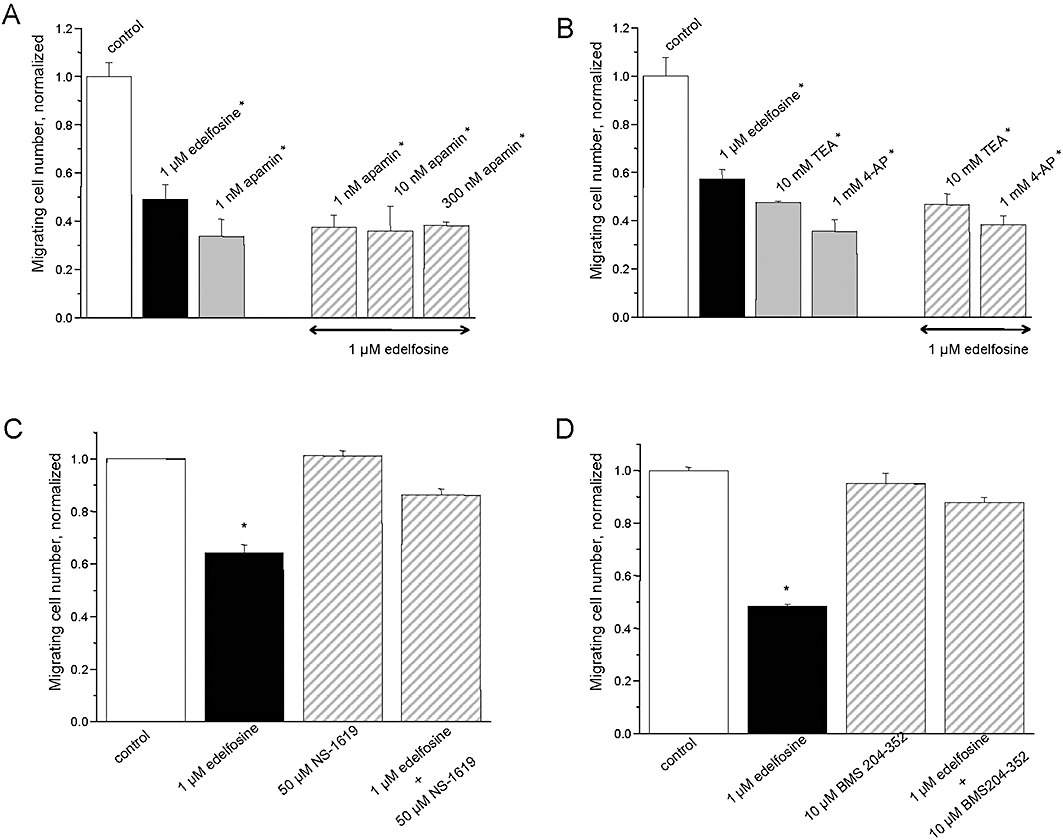
Figure 2.

Effects of edelfosine on MDA-MB-435s cell migration. Histograms showing the effect of apamin (A), tetraethylammonium (TEA), 4-aminopyridine (4-AP) (B) and of NS-1619 (C), BMS-204352 (D) with and without 1 µM edelfosine for 24 h. The normalized cell number corresponds to the ratio of the total number of migrating cells in the presence of drug/total number of migrating cells in control experiments. Results from two separate experiments performed in triplicate are expressed as mean ± SEM. *Significantly different from control at P < 0.05.
