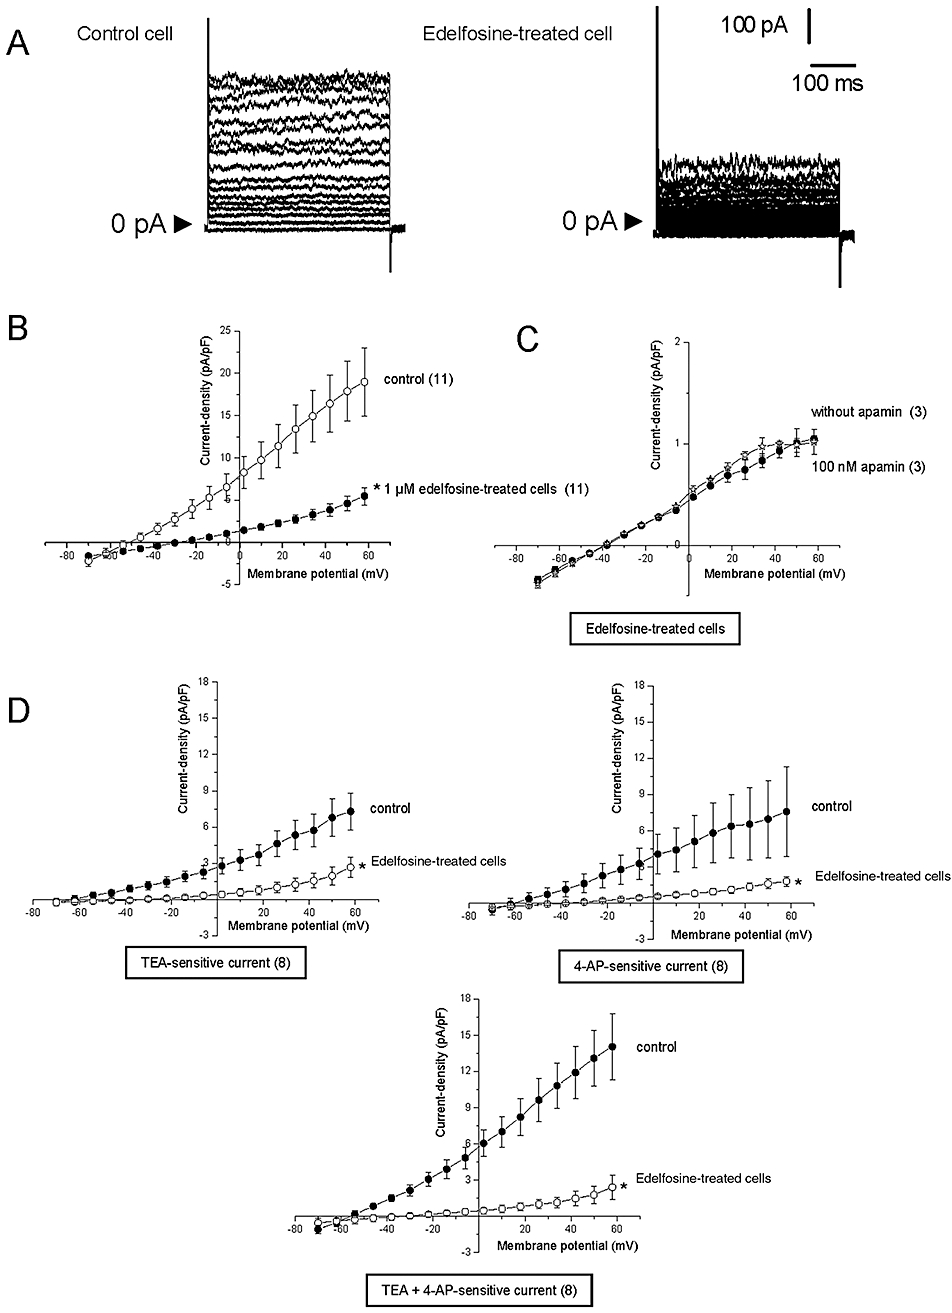
Figure 3.

Effects of edelfosine on SKCa currents of MDA-MB-435s cells. (A) Example of whole-cell K+ currents recorded in one cell grown in a normal medium (control) or after treatment with 1 µM edelfosine for 24 h. Currents were generated by stepwise 8 mV depolarizing pulses (400 ms duration; 5 s intervals) from a constant holding potential of −70 up to +58 mV. (B) Current density-voltage relationships obtained in control and in edelfosine-treated cells. The current density–voltage relation was obtained by dividing the averaged steady-state currents elicited between −70 and +58 mV by the respective cell capacitance. (C) Current density–voltage relations obtained in edelfosine-treated cells, with and without 100 nM apamin. (D) Tetraethylammonium/4-aminopyridine (TEA/4-AP)-sensitive current density–voltage relationships during voltage steps in untreated and in 24 h edelfosine-treated cells. The magnitude of TEA, 4-AP and TEA + 4-AP-sensitive currents were obtained by subtracting the outward current recorded in the presence of these drugs from the net outward current observed in normal physiological saline solution. These drug-sensitive currents were compared in control condition and following 24 h treatment with 1 µM edelfosine. Results represent the mean ± SEM *Significantly different from control at P < 0.05. The numbers in brackets indicate the number of cells.
