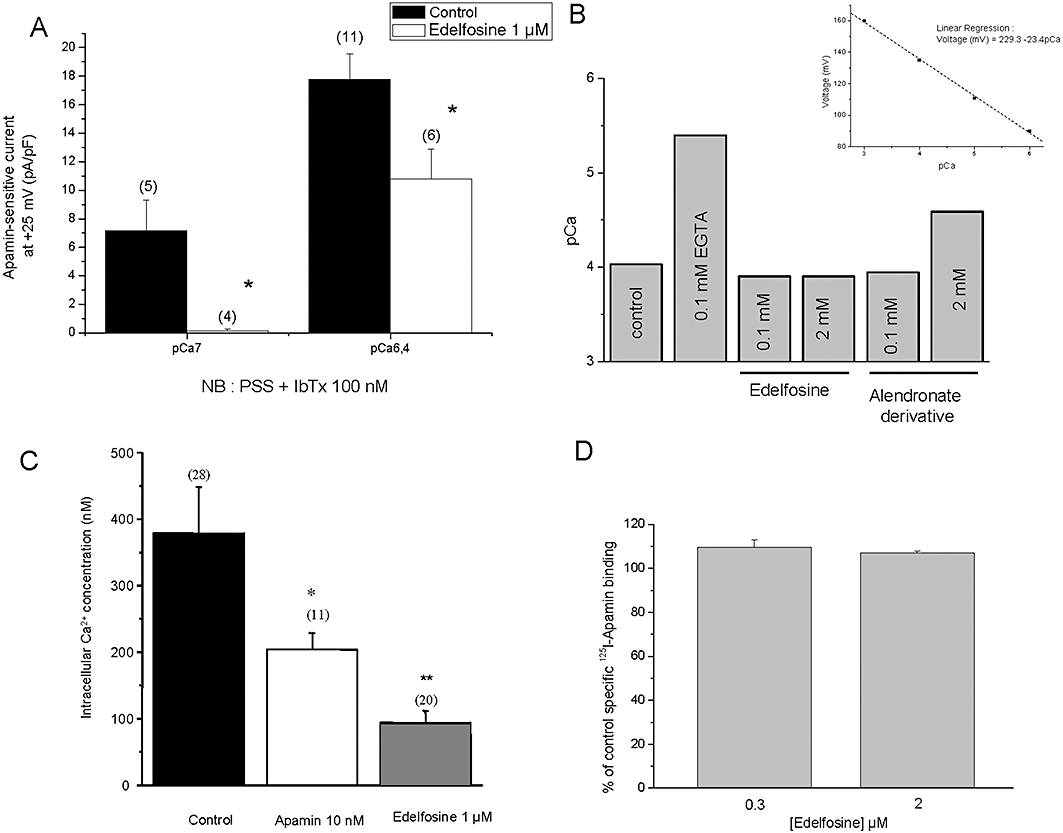
Figure 6.

Mechanisms of action of edelfosine on SK3/KCa2.3-dependent cell migration. (A) Apamin-sensitive currents recorded at +25 mV (holding potential =−70 mV). Whole-cell recordings of MDA-MB-435s cells were obtained at two pCa pipette solutions, pCa 7 and pCa 6.4 and in the presence of 100 nM iberiotoxin in order to completely block BKCa channels. Apamin-sensitive currents, defined as the difference between outward currents recorded in drug-free bath solution and after superfusion with 10 nM apamin, were recorded in physiological condition (control) and after 24 h treatment with 1 µM of edelfosine. *Significantly different from control at P < 0.05. The number of investigated cells is indicated in brackets. (B) Comparative effect of EGTA, edelfosine and alendronate derivative to complex calcium and to reduce pCa. Measurements of pCa values in a pCa4 solution (containing in mM: HEPES 10; EGTA 1, MgCl2 1, KCl, 150, CaCl2, 1.1, pH 7.2 KOH) as control solution and with increasing concentrations of edelfosine and an alendronate derivative. The pCa values were measured by a Ca2+-sensitive electrode. The inset is the voltage-pCa relationship obtained with the Ca2+-sensitive electrode and used to determine the pCa. Reported results were obtained in a single experiment and that was repeated two times. (C) Intracellular Ca2+ concentration [Ca2+]i was measured in MDA-MB-453s cells in physiological condition (control) and following 24 h treatment with 10 nM of apamin and 1 µM of edelfosine. [Ca2+]i was measured using the fluorescent dye Fura-2. *P < 0.05; **P < 0.01. The number of investigated cells is indicated in brackets. (D) Histogram showing the % of control specific binding of 125I-Apamin (7 pM) to SKCa channel obtained from membrane homogenates of cerebral cortex by 0.3 and 2 µM edelfosine.
