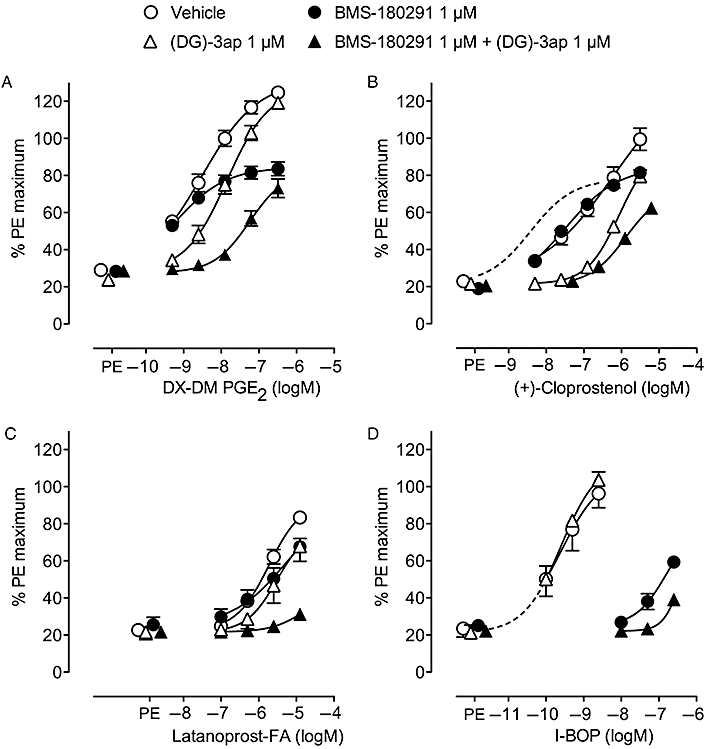
Figure 3.

Log concentration–response curves for prostanoid agonists on guinea-pig aorta under phenylephrine (PE) priming in the presence of vehicle, BMS-180291, (DG)-3ap and a combination of BMS-180291 and (DG)-3ap: (A) DX-DM PGE2 (B) (+)-cloprostenol (C) latanoprost-FA and (D) I-BOP. Responses were normalized to the maximum response to phenylephrine on each preparation in the presence of BMS-180291 + (DG)-3ap. Error bars indicate s.e.mean (n = 4). The broken line in B is the fitted curve for 17-phenyl PGE2 in the presence of 1 µM BMS-180291 obtained in contemporaneous experiments (mean priming = 21.5%, n = 10). The broken line in D is an extrapolation of the I-BOP/1 µM (DG)-3ap curve.
