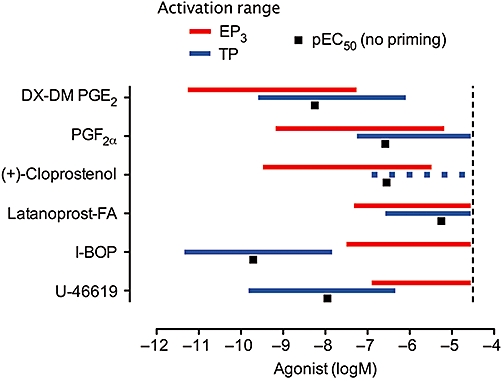
Figure 4.

EP3 and TP receptor activation ranges for prostanoid agonists under phenylephrine priming on guinea-pig aorta. Each horizontal bar represents the concentration range corresponding to E3– E97; the broken bar for (+)-cloprostenol indicates difficulty in estimation, because of interference from the other receptor activity. The black squares indicate pEC50 values in the absence of priming; the I-BOP data point derives from Jones et al. (2010) in which steady-state responses were obtained by applying single concentrations of I-BOP to multiple preparations. The vertical line represents a nominal upper limit of 30 µM.
