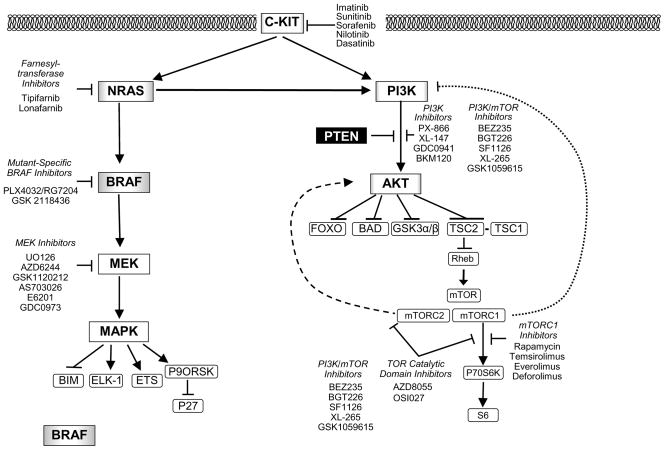
Figure 1. Kinase Signaling Pathways and Targeted Therapies for Melanoma.
The diagram illustrates key proteins in the RAS-RAF-MEK-MAPK and the PI3K-AKT kinase cascades. Arrows represent activation, while bars represent inhibition. Genes that are affected by activating mutations in melanoma (BRAF, NRAS, PI3K, C-KIT, and AKT) are shaded; the degree of shading reflects the relative prevalence of these mutations in cutaneous melanomas. Genes that are affected by genetic inactivation (PTEN) are shown with white type against a black background. The feedback regulation of PI3K and AKT by mTORC1 and mTORC2, respectively, is shown by the dashed lines. Classes and examples of targeted therapies against various effectors in the pathways are shown as free text beside the pathways.

