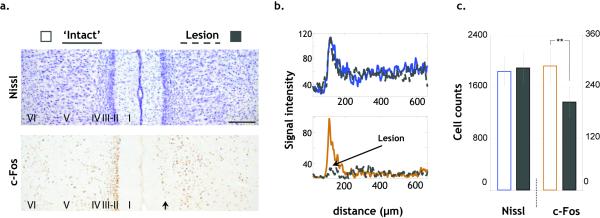
Figure 3.
a) Photomicrographs of representative sections showing the very clear c-Fos but not Nissl, reduction indicated by the arrow in Rgb ipsilateral to the anterior thalamic nuclei lesions. The laminae are identified in each photomicrograph. The scale bar represents 200 μm. b) The selective loss of c-Fos protein is shown by the normal pattern of signal intensity in the cresyl violet sections (upper) compared with the c-Fos labelled sections (lower), with 0-600 μm corresponding to laminae I-VI. Note the difference in the superficial laminae. The horizontal mean profile was derived by analySIS^D (Olympus, UK). Measures of the grey value intensity of each pixel were made along a horizontal plane, and all of these were averaged to produce a laminar profile of signal intensity. (c) Significant reduction of c-Fos-positive cells but not Nissl-stained cells in the Lesion hemisphere (**p<0.0001, see text).

