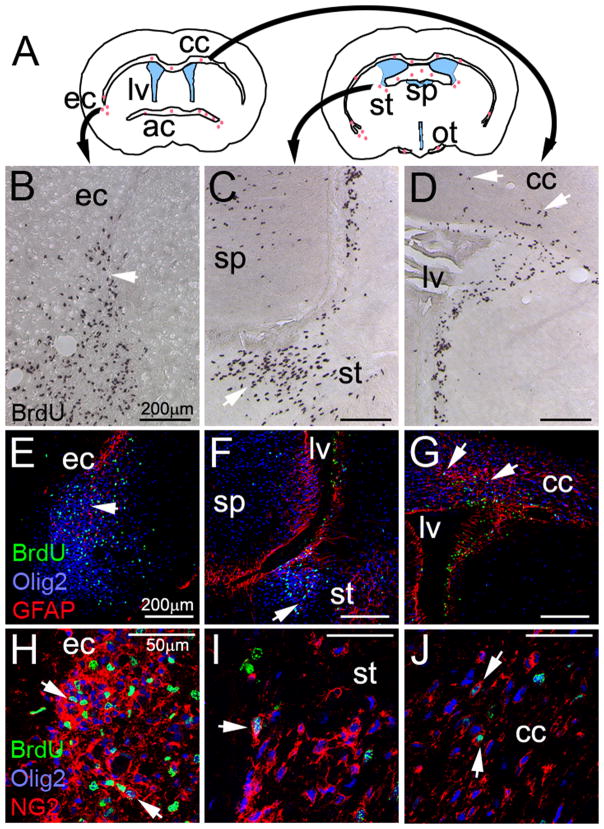
Figure 2. Expression of NG2 and GFAP in proliferative regions in premalignant mice.
(A) Illustration of two coronal sections of a mouse brain. Red dots represent brain regions that incorporated BrdU in P30 E/p53−/− mice at 2 hr. Lateral ventricles (lv) are shown in blue. ec--external capsule, cc--corpus callosum, ac--anterior commisure, sp--septum pellucidum, st--stria terminalis, ot--optic tract. (B–D) Incorporation of BrdU (arrows). (E–G) Expresssion of the early glial marker Olig2 and the astrocytic marker GFAP in BrdU+ cells. (H–J) Co-expression of Olig2+ and NG2 in BrdU+ cells. See also Figure S2.

