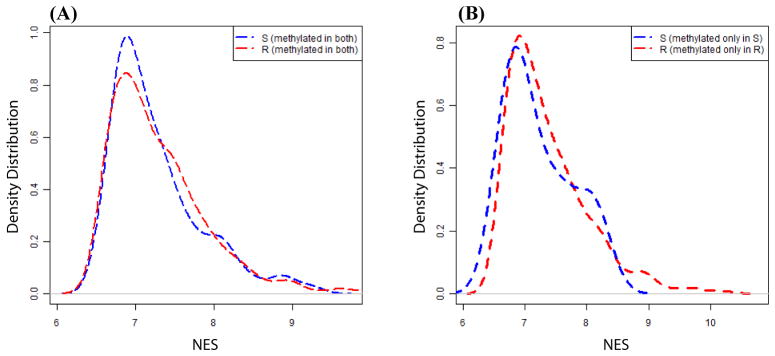
Figure 5. Relationship between LRES and CIMP.
(A and B) Neighborhood expression score (NES) for every gene was calculated as the median expression values of three upstream and three downstream genes. The NES was used as a measure of LRES. A and B shows distribution of the NES values for genes methylated in both SW480 and RKO (A) and genes methylated only in SW480 or only in RKO (B). S and R in legend denote SW480 and RKO.

