
Figure 11.
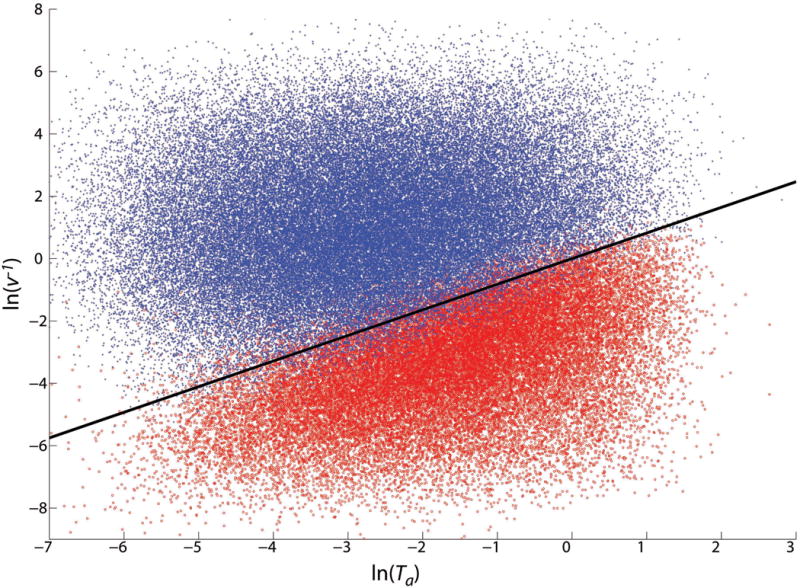
(Color online) Each point represents a parameter set for which pattern formation was predicted. The pattern was either observed as predicted (dark, blue), or an unpatterned (i.e. all cells active) propagating front was observed (light, red); parameter sets with other behaviors are not shown (see Fig. 12). Horizontal axis, shortest possible time for a cell experiencing maximum activation to reach high enough a to fully inhibit its nearest neighbor. Vertical axis, inverse front velocity. This approximates the amount of time it takes the average h-front to advance one lattice site. The black line optimally separates the two possible outcomes. It successfully classifies about 95% of these parameter sets. The switch and template pattern formation mechanism begins to fail when the internal dynamics of a cell can no longer be considered fast compared to front propagation.