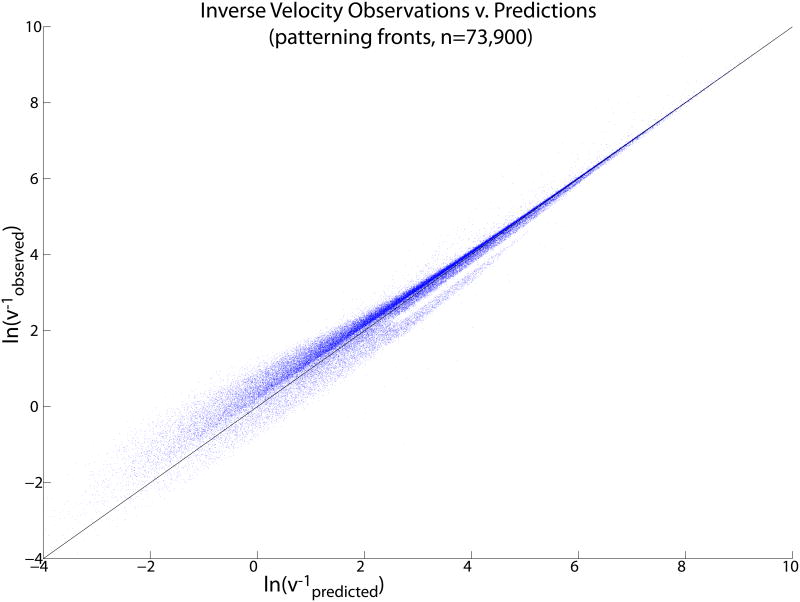
Figure 13.
(Color online) Comparison of observed front velocity from integration of Eq. (5) to analytic predictions based on the fast-a approximation, for parameter sets that lead to stably propagating patterns with the predicted wavelength. Each dot is a parameter set. The prediction becomes relatively better as the front slows down, as expected.

