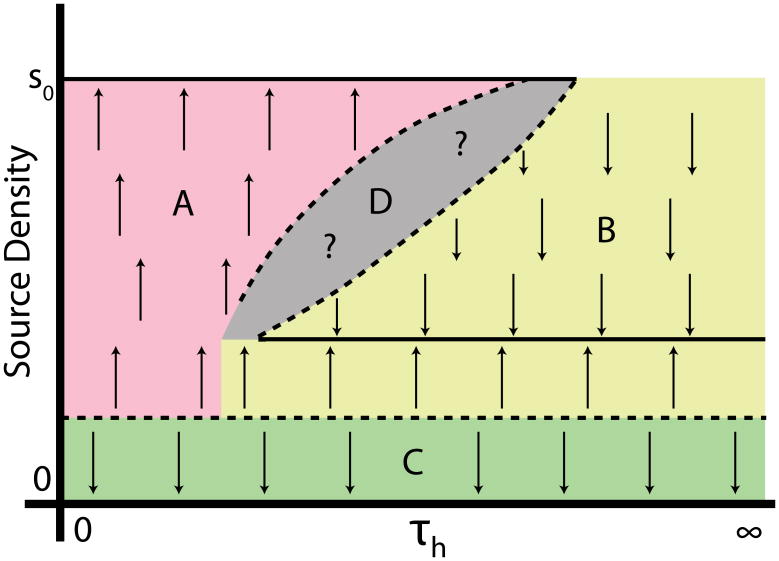
Figure 14.
(Color online) Schematic one-parameter bifurcation diagram for front propagation and pattern formation, showing the stable solution types discussed in this paper and their basins of attraction. Solid lines, stable long-time behaviors; dotted lines, unstable behaviors. Arrows indicate the direction in which the system evolves over time. We take the source density for h (i.e. the fraction of cells in an active, or high a state) as the output state; it can range from 0 (stalled) to s0, the maximum activity of a single cell. The bifurcation parameter τh controls the relative timescales of front motion and of activation of a single cell. Our analytic predictions (Sec. 4) apply for large τh, and thus for regions B and C, which correspond, respectively, to stalled fronts and to OUID patterns. If the initial pattern density is too low, front propagation cannot occur, and the system lies in region C. A system that produces enough h, and where h dynamics are slow enough compared to a (region B), is attracted to a regular patterning solution. If h dynamics are not slow, then many cells can be activated before any is able to inhibit another, and a propagating front characterized by a maximum-density pattern is observed (region A). The structure of the boundary between regions A and B is unknown (gray, region D), but there are parameter sets where stable patterning and unpatterned front propagation are observed for different initial conditions (see Fig. 3).

