Abstract
Parathyroid hormone (PTH) is the major hormone regulating bone remodeling. Binding of PTH to the PTH1 receptor (PTH1R), a heterotrimeric G protein coupled receptor (GPCR), can potentially trigger multiple signal transduction pathways mediated through several different G proteins. In this study, we employed G protein antagonist minigenes inhibiting Gαs, Gαq or Gα12 to selectively dissect out which of these G proteins were responsible for effects of PTH(1–34) in targeted signaling and osteogenesis arrays consisting of 159 genes. Among the 32 genes significantly regulated by 24 hr PTH treatment in UMR-106 osteoblastic cells, 9 genes were exclusively regulated through Gs, 6 genes were solely mediated through Gq, and 3 genes were only controlled through G12. Such findings support the concept that there is some absolute specificity in downstream responses initiated at the G protein level following binding of PTH to the PTH1R. On the other hand, 6 PTH-regulated genes were regulated by both Gs and Gq, 3 genes were regulated by both Gs and G12, and 3 genes were controlled by Gs, Gq and G12. These findings indicate potential overlapping or sequential interactions among different G protein-mediated pathways. In addition, two PTH-regulated genes were not regulated through any of the G proteins examined, suggesting additional signaling mechanisms may be involved. Selectivity was largely maintained over a 2 – 48 hour time period. The minigene effects were mimicked by downstream inhibitors. The dissection of the differential effects of multiple G protein pathways on gene regulation provides a more complete understanding of PTH signaling in osteoblastic cells.
Keywords: Parathyroid hormone, Osteoblast, Gene array, G protein, Minigene
1.1 Introduction
Parathyroid hormone (PTH), an endocrine factor secreted by the parathyroid glands, is the major hormone regulating bone remodeling. PTH has both anabolic and catabolic effects on bone in vivo mediated through its activation of the PTH1 receptor (PTH1R) expressed on osteoblastic cells. PTH1R mediates intracellular responses largely through heterotrimeric guanine nucleotide binding proteins (G proteins) and thus is a member of the superfamily of G protein coupled receptors (GPCRs). As is observed with many GPCRs, PTH1R may signal through several different G proteins in parallel, thus activating multiple signal transduction pathways [1]. The heterotrimeric G proteins are composed of three subunits (alpha (α), beta (β), and the smaller gamma (γ) subunits). Four subfamilies of G protein have been identified in humans and they are classified according to their α subunits: Gs, Gq/11, Gi/o and G12/13.
The best defined signaling pathway activated by PTH in osteoblastic cells is the protein kinase A (PKA) pathway, by which PTH stimulates the formation of cyclic 3′,5′-adenosine monophosphate (cAMP) through the action of the stimulatory Gs protein. PKA activated by cAMP subsequently phosphorylates transcription factors such as the activator protein-1 (AP-1) family (c-jun, c-fos), cAMP-response element-binding (CREB) protein, and Cbfa1/Runx2, thereby regulating transcription of a number of genes important to bone formation including those genes that contain an AP-1 promoter element (e.g., matrix metallopeptidase 13) or the runt domain promoter element (e.g., Bcl-2, osteocalcin, osteopontin, collagen I). Studies on gene expression profiles of PTH-regulated genes in UMR-106 cells showed that PTH(1–34) regulated several genes (transcription factor CEBP, interferon γ receptor, metallothionein-1, lumican, selenoprotein P) in the same direction as occurs during osteoblast differentiation [2]. The Gs-cAMP-PKA pathway is thought to be the dominant mechanism for the anabolic actions of intermittent PTH(1–34) on bone, these actions being mediated through increased osteoblast survival and differentiation [3]. There is also evidence for sustained activation of cAMP, mediated through an internalized PTH(1–34)/PTH1R/Gs ternary complex [4].
In addition to the Gs-cAMP-PKA pathway, binding of PTH to PTH1R also activates phospholipase C (PLC) β through Gq, leading to the formation of diacylglycerol and 1,4,5-inositol trisphosphate, which go on to activate protein kinase C (PKC) and increase intracellular free Ca2+. Only a small number of genes have been found to be regulated by PTH partially or completely through the PKC pathway in osteoblastic cells, and these include insulin-like growth factor binding protein 5 (IGFBP5) and transforming growth factor (TGF) β1 [5, 6]. Treatment with low concentrations of PTH promoted proliferation of UMR106 cells as a consequence of PKC-dependent stimulation of ERK and MAPK signaling and regulation of cyclin D1 [7]. Such actions suggest that the Gq-PLCβ-PKC mediated signaling pathway could be involved in PTH-induced cell proliferation.
Besides the well-defined Gs-driven PKA and Gq-driven PKC pathways, our earlier studies showed that PTH was able to activate a G12/13-mediated signaling pathway, which stimulated RhoA/Rho kinase and phospholipase D (PLD) activities in osteoblastic cells [8, 9]. Importantly, RhoA, Rho kinase and phosphatidic acid phosphatase were shown to be essential for PTH effects on PKCα translocation in UMR-106 cells [10, 11]. Recently we have shown that disruption of RhoA signaling in osteoblastic cells results in loss of actin cytoskeletal elements [12] and increased osteoblastic cell apoptosis [13].
The activation of multiple signaling pathways by PTH may constitute a complex system of regulation, through crosstalk between these G protein pathways. Although the Gs-cAMP-PKA pathway is considered to be the major mechanism for transducing PTH signals, the pathways mediated through Gq-PLC-PKC and G12-RhoA-PLD may also play important roles in PTH-mediated anabolic and catabolic effects, with each pathway independently regulating unique sets of transcription factors and genes. The dual anabolic and catabolic effects of PTH in osteoblasts would thus be a sum of actions resulting from the diverse signaling cascades initiated by the different G proteins. In this study, we use selective inhibition by G protein antagonist minigenes to identify genes that are regulated specifically by one G protein-mediated pathway or another, as well as genes that are regulated by two or more G proteins, suggesting that some overlapping or sequential signaling may exist. The ability to dissect out differential effects of G protein signaling initiated by activation of PTH1R contributes to a more complete understanding of how PTH can mediate its observed opposing effects on bone.
2.1 Materials and Methods
2.1.1 Gα C-terminal minigene vectors
Gα C-terminal minigene vectors were used to block the signaling mediated by Gs, Gq, or G12 on gene expression. Gα C-terminal minigene vectors encode the unique COOH-terminal sequence for each G protein α subunit. Since the C-terminal sequences of Gα subunits are critical for binding to their cognate GPCRs, the minigene vectors selectively block signal transduction through a given G protein while leaving other G protein signaling pathways intact. This system is a powerful tool for dissecting out which G protein mediates a given biochemical or physiological function [9, 14–17], and has been used previously in other models in which a receptor couples to multiple G proteins [18, 19].
2.1.2 Cell culture, transfection and treatments
Rat osteoblastic UMR-106 cells (American Type Culture Collection, Manassas, VA) and rat osteoblastic ROS 17/2.8 cells (kindly provided by Dr. Peter Friedman, University of Pittsburgh) were transiently transfected with minigene vectors expressing C-terminal peptides of Gs, Gq, and G12 respectively, using Lipofectamine Plus reagents (Invitrogen, Carlsbad, CA). The parental vector pcDNA3.1, was used as an empty minigene vector (EV) control. After 24 hours, the cells were treated with PTH(1–34) at 10 nM for an additional 24 hours. The cells were then collected to extract total RNA for gene expression analysis. Transfection with GFP-tagged EV showed close to 100% transfection efficiency in both the UMR-106 and ROS 17/2.8 cells (data not shown). Pharmacological inhibitors were the PKA inhibitor protein kinase A inhibitor 14–22 amide (PKI) (Calbiochem, San Diego, CA), the PLC inhibitor U-73122 (Calbiochem), and the geranylgeranyl transferase I inhibitor GGTI-2133 (Calbiochem).
2.1.3 Gene expression profiling using qPCR gene array
Total RNA was extracted from the cells using a RNeasy kit (Qiagen, Valencia, CA). Genomic DNA contamination was eliminated and the first strand cDNA was synthesized from 1 μg total RNA using a RT2 first strand kit (SABiosciences, Frederick MD). Gene expression profiles in the cells were studied using two types of targeted arrays purchased from SABiosciences, an osteogenesis PCR array consisting of 84 key genes related to bone formation and bone resorption and a signal transduction PathwayFinder PCR array containing 84 key genes representative of 18 different signal transduction pathways. Each of the arrays also contains 5 different housekeeping genes as loading controls for normalization. In addition to the housekeeping genes, nine genes appear on both arrays, these being Bmp2, Bmp4, Fn1, Icam1, Mmp10, Nfkb1, Tnf, Vcam1, and Vegfa. By using the two types of arrays, we were able to study the expression of 159 different target genes. The cDNA samples mixed with qPCR master mix (containing SYBR green) were loaded in 96-well PCR arrays and qPCR reactions were performed on a BioRad (Hercules, CA) iQ real-time PCR detection system. After denaturing the template and activating the HotStart DNA polymerase at 95°C for 10 minutes, the two-step cycling program was run for 40 cycles at 95°C for 15 seconds, and 60°C for 60 seconds. The PCR array data were analyzed using Excel-based data analysis templates (SABiosciences), performing ΔΔCt based fold-change calculations from raw threshold cycle data. Pair-wise comparisons between test samples and control samples were performed. Any genes that were increased or decreased more than two fold with a P value less than 0.05 were considered to be significantly modified.
2.1.4 RT-PCR
cDNA was synthesized using 1 μg total RNA and a reverse transcription system (Promega, Madison, WI). PCR was performed in a 25-μl reaction solution containing Platinum Taq DNA polymerase and cDNA template. After denaturing the template and activating the polymerase at 94°C for 2 minutes, the PCR reaction was run for 30–40 cycles at: 94°C for 15 seconds, 55–60°C for 30 seconds, and 72°C for 60 seconds.
3.1 Results
3.1.1 PTH regulates genes related to multiple signaling pathways and osteogenesis in UMR-106 osteoblastic cells
Based on the criteria described in the Methods (section 2.1.3), twenty genes were found to be regulated by PTH(1–34) on the signaling pathway array (Table 1A), and fifteen genes were found to be regulated by PTH on the osteogenesis array (Table 1B). Three genes (Tnf, Fn1,Vegfa) were regulated by PTH on both the signaling pathway array and the osteogenesis array. Thus, 32 different genes were regulated by PTH out of the 159 genes studied.
Table 1.
Genes regulated by PTH treatment (10−8M for 24 hr)
| A. Signaling Pathway Array | ||||
|---|---|---|---|---|
| Gene Symbol | Gene Name | Accession Number | Fold Difference | P Value |
| Fos | FBJ osteosarcoma oncogene | NM_022197 | 14.6 | 0.026 |
| Hsf1 | Heat shock transcription factor 1 | XM_001061027 | 8.7 | 0.008 |
| Myc | Myelocytomatosis oncogene | NM_012603 | 7.8 | 0.017 |
| Fgf4 | Fibroblast growth factor 4 | NM_053809 | 6.8 | 0.048 |
| Cdh1 | Cadherin 1 | NM_031334 | 5.0 | 0.044 |
| Igfbp3 | Insulin-like growth factor binding protein 3 | NM_012588 | 4.2 | 0.012 |
| Mmp7 | Matrix metallopeptidase 7 | NM_012864 | 3.9 | 0.045 |
| Egr1 | Early growth response 1 | NM_012551 | 3.8 | 0.014 |
| Tnf | Tumor necrosis factor | NM_012675 | 3.5 | 0.021 |
| Pmepa1 | Prostate transmembrane protein, androgen induced 1 | XM_230899 | 3.1 | 0.048 |
| Cyp19a1 | Cytochrome P450, family 19, subfamily a, polypeptide 1 | NM_017085 | 2.6 | 0.030 |
| Cebpb | CCAAT/enhancer binding protein, beta | NM_024125 | 2.5 | 0.027 |
| Gadd45a | Growth arrest and DNA-damage-inducible, alpha | NM_024127 | 2.3 | 0.036 |
| Rbp1 | Retinol binding protein 1, cellular | NM_012733 | 2.2 | 0.011 |
| Fn1 | Fibronectin 1 | NM_019143 | 2.2 | 0.039 |
| Foxa2 | Forkhead box A2 | NM_012743 | −2.0 | 0.023 |
| Fasn | Fatty acid synthase | NM_017332 | −2.0 | 0.014 |
| Hk2 | Hexokinase 2 | NM_012735 | −2.0 | 0.035 |
| Birc3 | Baculoviral IAP repeat-containing 3 | NM_023987 | −2.9 | 0.017 |
| Vegfa | Vascular endothelial growth factor A | NM_031836 | −5.2 | 0.002 |
| B. Osteogenesis Array | ||||
|---|---|---|---|---|
| Gene Symbol | Gene Name | Accession Number | Fold Difference | P Value |
| Egf | Epidermal growth factor | NM_012842 | 5.8 | 0.019 |
| Tgfb1 | Transforming growth factor, beta 1 | NM_021578 | 5.5 | 0.037 |
| Pdgfa | Platelet derived growth factor, alpha | NM_012801 | 4.4 | 0.040 |
| Tnf | Tumor necrosis factor | NM_012675 | 4.0 | 0.008 |
| Igf1 | Insulin-like growth factor 1 | NM_178866 | 3.8 | 0.019 |
| Mmp8 | Matrix metallopeptidase 8 | NM_022221 | 3.7 | 0.007 |
| Col3a1 | Procollagen, type III, alpha 1 | NM_032085 | 3.5 | 0.038 |
| Fn1 | Fibronectin 1 | NM_019143 | 2.6 | 0.028 |
| Col14a1 | Procollagen, type XIV, alpha 1 | XM_235308 | 2.0 | 0.026 |
| Flt1 | FMS-like tyrosine kinase 1 | NM_019306 | −2.0 | 0.017 |
| Itgav | Integrin alpha V | XM_230950 | −2.1 | 0.010 |
| Bmp3 | Bone morphogenetic protein 3 | NM_017105 | −3.1 | 0.003 |
| Bmp7 | Bone morphogenetic protein 7 | XM_342591 | −3.1 | 0.004 |
| Vegfa | Vascular endothelial growth factor A | NM_031836 | −7.1 | 0.008 |
| Fgf1 | Fibroblast growth factor 1 | NM_012846 | −9.5 | 0.023 |
3.1.2 PTH effects on gene expression are differentially regulated by antagonist minigenes to Gs, Gq and G12
After the cells were transfected with Gs, Gq or G12 minigenes to block receptor signaling through the respective individual G protein (other G protein signaling remains intact), the effects of PTH on gene expression were studied and compared with control (EV-transfected) cells. Among the thirty-two genes that were significantly regulated by PTH, several groups of genes showed different patterns of antagonism dependent on the specific minigene transfected, as shown in Table 2.
Table 2.
Genes regulated by PTH and antagonized by G protein minigenes
| A. PTH-regulated genes antagonized only by Gs minigene | ||||||
|---|---|---|---|---|---|---|
| Gene Symbol | Gs minigene + PTH vs EV+PTH | Gq minigene + PTH vs EV + PTH | G12 minigene + PTH vs EV + PTH | |||
| Ratio | P value | Ratio | P value | Ratio | P value | |
| Myc | 0.1 | 0.018 | 0.6 | 0.392 | 0.8 | 0.358 |
| Egf | 0.4 | 0.011 | 1.2 | 0.226 | 1.6 | 0.109 |
| Pdgfa | 0.2 | 0.003 | 1.3 | 0.407 | 1.2 | 0.307 |
| Igfbp3 | 0.3 | 0.026 | 0.7 | 0.435 | 0.8 | 0.089 |
| Cyp19a1 | 0.3 | 0.019 | 1.8 | 0.070 | 0.7 | 0.195 |
| Rbp1 | 0.5 | 0.041 | 1.0 | 0.986 | 1.7 | 0.742 |
| Fasn | 2.1 | 0.010 | 0.5 | 0.397 | 0.6 | 0.580 |
| Flt1 | 4.5 | 0.039 | 0.7 | 0.134 | 0.9 | 0.849 |
| Fgf1 | 4.2 | 0.010 | 0.9 | 0.135 | 0.9 | 0.072 |
| B. PTH-regulated genes antagonized only by Gq minigene | ||||||
|---|---|---|---|---|---|---|
| Gene Symbol | Gs minigene + PTH vs EV+PTH | Gq minigene +PTH vs EV + PTH | G12 minigene + PTH vs EV+PTH | |||
| Ratio | P value | Ratio | P value | Ratio | P value | |
| Tgfb1 | 1.4 | 0.267 | 0.2 | 0.006 | 1.3 | 0.274 |
| Egr1 | 08 | 0.708 | 0.4 | 0.021 | 1.0 | 0.991 |
| Igf1 | 0.6 | 0.211 | 0.2 | 0.008 | 1.0 | 0.961 |
| Tnf* | 0.7 | 0.600 | 0.5 | 0.004 | 2.6 | 0.259 |
| Tnf** | 0.8 | 0.123 | 0.2 | 0.013 | 0.9 | 0.849 |
| Bmp3 | 1.2 | 0.895 | 2.2 | 0.008 | 1.0 | 0.961 |
| Bmp7 | 0.9 | 0.870 | 3.3 | 0.026 | 1.4 | 0.464 |
| C. PTH-regulated genes antagonized only by G12 minigene | ||||||
|---|---|---|---|---|---|---|
| Gene Symbol | Gs minigene + PTH vs EV+PTH | Gq minigene +PTH vs EV + PTH | G12 minigene + PTH vs EV+PTH | |||
| Ratio | P value | Ratio | P value | Ratio | P value | |
| Mmp8 | 1.2 | 0.365 | 1.3 | 0.573 | 0.1 | 0.008 |
| Gadd45a | 0.8 | 0.492 | 0.7 | 0.346 | 0.3 | 0.022 |
| Foxa2 | 0.6 | 0.027 | 0.6 | 0.024 | 2.0 | 0.012 |
| D. PTH-regulated genes antagonized by either Gs or Gq minigene | ||||||
|---|---|---|---|---|---|---|
| Gene Symbol | Gs minigene + PTH vs EV+PTH | Gq minigene + PTH vs EV + PTH | G12 minigene + PTH vs EV+PTH | |||
| Ratio | P value | Ratio | P value | Ratio | P value | |
| Hsf1 | 0.4 | 0.002 | 0.5 | 0.003 | 1.0 | 0.574 |
| Fgf4 | 0.2 | 0.032 | 0.3 | 0.044 | 0.6 | 0.133 |
| Cdh1 | 0.2 | 0.004 | 0.2 | 0.006 | 1.0 | 0.744 |
| Mmp7 | 0.3 | 0.042 | 0.2 | 0.016 | 1.5 | 0.253 |
| Col3a1 | 0.2 | 0.014 | 0.5 | 0.017 | 1.1 | 0.675 |
| Fn1* | 0.4 | 0.012 | 0.4 | 0.015 | 0.7 | 0.252 |
| Fn1** | 0.3 | 0.035 | 0.3 | 0.025 | 1.5 | 0.079 |
| E. PTH-regulated genes antagonized by either G2 or G12 minigene | ||||||
|---|---|---|---|---|---|---|
| Gene Symbol | Gs minigene + PTH vs EV+PTH | Gq minigene +PTH vs EV + PTH | G12 minigene + PTH vs EV+PTH | |||
| Ratio | P value | Ratio | P value | Ratio | P value | |
| Cebpb | 0.1 | 0.044 | 1.0 | 0.883 | 0.3 | 0.010 |
| Coll4a1 | 0.1 | 0.012 | 0.8 | 0.200 | 0.4 | 0.009 |
| Itgav | 5.4 | 0.012 | 0.9 | 0.495 | 8.9 | 0.004 |
| F. PTH-regulated genes antagonized by either Gs Gq or G12 minigene | ||||||
|---|---|---|---|---|---|---|
| Gene Symbol | Gs minigene + PTH vs EV+PTH | Gq minigene +PTH vs EV + PTH | G12 minigene + PTH vs EV+PTH | |||
| Ratio | P value | Ratio | P value | Ratio | P value | |
| Fos | 0.04 | 0.0002 | 0.1 | 0.0001 | 0.1 | 0.0002 |
| Birc3 | 5.1 | 0.0015 | 5.3 | 0.0014 | 12.9 | 0.0006 |
| Vegfa* | 5.1 | 0.0015 | 2.5 | 0.0047 | 6.9 | 0.0010 |
| Vegfa** | 4.5 | 0.0192 | 2.5 | 0.0194 | 4.1 | 0.0090 |
| G. PTH-regulated genes antagonized by neither Gs, Gq nor G12 minigene | ||||||
|---|---|---|---|---|---|---|
| Gene Symbol | Gs minigene + PTH vs EV+PTH | Gq minigene +PTH vs EV + PTH | G12 minigene + PTH vs EV+PTH | |||
| Ratio | P value | Ratio | P value | Ratio | P value | |
| Pmepa1 | 0.7 | 0.238 | 0.7 | 0.272 | 0.8 | 0.423 |
| Hk2 | 0.8 | 0.038 | 0.7 | 0.083 | 1.1 | 0.103 |
on signaling pathway array;
on osteogenesis array
Group A
Gene expression antagonized only by the Gs minigene: As shown in Table 2A, PTH up-regulated the expression of Myc, Egf, Pdgfa. Igfbp3, Cyp19a1, and Rbp1, and these changes were blocked in cells expressing the Gs minigene but not cells transfected with the Gq or G12 minigene. PTH down-regulated the expression of Fasn, Flt1 and Fgf1, and expression of the Gs minigene selectively reversed these effects. The results indicate that the expression of this group of 9 genes is regulated by PTH through Gs signaling.
Group B
Gene expression antagonized only by the Gq minigene: As shown in Table 2B, PTH up-regulated the expression of Tgfb1, Egr1, Igf1, and Tnf, while the hormone down-regulated the expression of Bmp3 and Bmp7. The effects of PTH on these genes were antagonized by the Gq minigene but not by the Gs or G12 minigene, indicating that expression of this group of 6 genes is regulated by PTH through Gq signaling.
Group C
Gene expression antagonized only by the G12 minigene: Three genes were found to be selectively regulated by PTH through G12 signaling (Table 2C). PTH treatment increased the expression of Mmp 8 and Gadd45a, and decreased the expression of Foxa2, and these effects were inhibited by the G12 minigene, but not by the Gs or Gq minigene.
Although a number of genes were exclusively blocked by only one Gα C-terminal minigene, and presumably were initiated solely through signaling downstream of that G protein, other genes were found to be blocked by two or more G protein minigenes (Group D, E, F). The regulation of some genes by multiple G protein minigenes suggests the possibility of crosstalk among the three different G proteins studied (Gs, Gq, G12).
Group D
Gene expression antagonized by the Gs or Gq minigenes but not by the G12 minigene: Expression of six genes (Hsf1, Fgf4, Cdh1, Mmp7, Col3a1 and Fn1) was found to be up-regulated by PTH and blocked to a similar extent by either the Gs minigene or the Gq minigene (Table 2D), indicating that PTH may regulate expression of these genes through both Gs and Gq pathways.
Group E
Gene expression antagonized by Gs or G12 minigenes but not by the Gq minigene:
Up-regulation of Cebpb and Col14a as well as down-regulation of Itgav by PTH treatment were eliminated by transfection of either the G12 minigene or the Gs minigene (Table 2E), which indicated that the PTH-stimulated expression of these three genes could be regulated by both signaling pathways.
Group F
Gene expression antagonized by Gs, or Gq, or G12 minigenes:
The effects of PTH on c-Fos (Fos), Birc3 and Vegfa were antagonized by all three minigenes (Table 2F), indicating that these genes could be regulated through all three G protein-mediated pathways.
Group G
PTH-regulated gene expression not antagonized by Gs, Gq, or G12 minigenes: In addition to the PTH effects mediated through Gs, Gq, or G12, there were some responses not altered by any minigenes. PTH treatment increased the expression of Pmepa1 while decreasing the expression of Hk2. Neither of these effects were altered by the presence of any of the minigenes tested (Table 2G). This result indicates that PTH-mediated changes in Pmepa1 and Hk2 gene expression may be regulated through pathways independent of Gs, Gq and G12.
3.1.3 RT-PCR confirmation of differential antagonism by minigenes on selected PTH-regulated genes
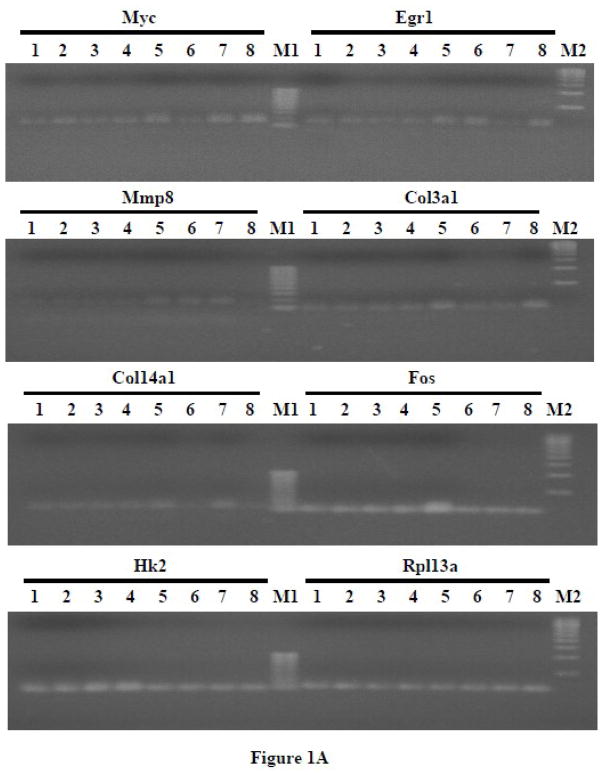
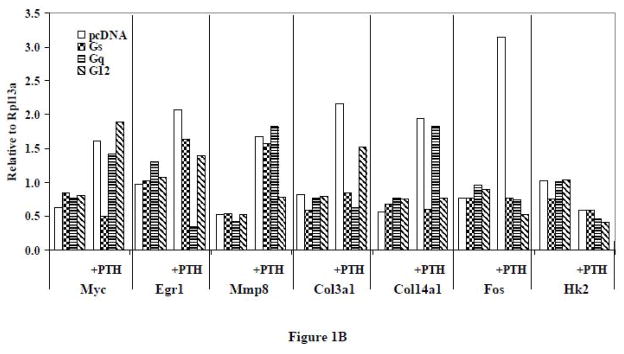
In order to verify the results from gene array experiments, RT-PCR studies were carried out. UMR-106 cells were transfected with G protein minigenes or empty vector (pcDNA) and then treated with PTH (10 nM) for 24 hr. Representative genes from groups A to G as identified by the gene array experiments (Myc, Egr1, Mmp8, Col3a1, Col14a1, Fos and Hk2) were examined using RT-PCR. In order to assess whether the observed effects on gene expression were the result of constitutively inhibiting G protein signaling or were only noted following PTH treatment, the expression level of genes in cells transfected with the minigenes but which did not receive PTH treatment was also examined.
As evidenced in Figure 1, the basal expression of the seven selected genes was not significantly affected by the presence of the Gα minigenes. With PTH treatment, the expression of Myc, Egr1, Mmp8, Col3a1, Col14a1, and Fos was increased, while the expression of Hk2 was decreased, as was observed with the gene array experiments. Although the results were consistent with those observed in the gene array experiments, the magnitudes of the increases or decreases were different. This could be due to variation between independent experiments or to differences in sensitivity obtained with qRT-PCR versus conventional RT-PCR. As was detected in the qRT-PCR arrays, PTH-stimulated up-regulation of Myc (from group A), Egr1 (from group B) and Mmp8 (from group C) were exclusively inhibited by Gs, Gq and G12 minigenes, respectively. The effects of PTH on Col3a1 (from group D) were blocked by Gs and Gq minigenes, while the effects on Col14a1 (from group E) were blocked by Gs and G12 minigenes. The PTH-stimulated increase of Fos (from group F) was inhibited by all three G protein minigenes. The PTH-induced decrease of Hk2 (from group G) was not affected by any of the minigenes.
Figure 1.
(A) RT-PCR of representative genes that were regulated by PTH and affected by different G protein minigenes in UMR-106 cells. The cells were transfected with G protein minigenes or empty vector (pcDNA), and then were treated with PTH (10 nM) for 24 hr. Lane 1, pcDNA transfected; Lane 2, Gs minigene transfected; Lane 3, Gq mingene transfected; Lane 4, G12 minigene transfected; Lane 5, pcDNA transfected + PTH; Lane 6, Gs minigene transfected + PTH; Lane 7, Gq mingene transfected + PTH; Lane 8, G12 minigene transfected + PTH; M1, 100bp molecular ruler; M2, 500bp molecular ruler. (B) The relative expression levels of genes were analyzed and normalized against the housekeeping gene Rpl13a. The bands shown in Figure 1A were scanned and quantified for the analysis.
3.1.4 Replication of the effects in the ROS 17/2.8 cell line
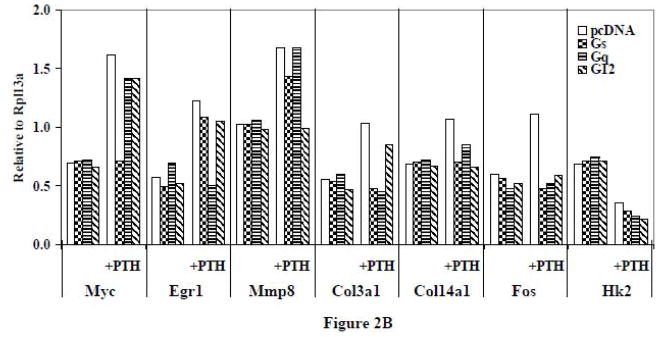
To determine if the results observed were found only in UMR-106 cells or could be replicated in another osteoblast cell line, ROS 17/2.8 cells were transfected with the G protein minigenes and treated with PTH. RT-PCR was carried out on the same representative genes as were examined as in section 3.1.3. In PTH treated ROS 17/2.8 cells (Figure 2), the responses were remarkably similar to those that had been seen in the UMR-106 cells, with 24 hour treatment leading to an increased gene expression of Myc, Egr1, Mmp8, Col3a1, Col14a1, and Fos, while the expression of Hk2 was decreased. Moreover, Myc, Egr1, and Mmp8 were exclusively inhibited by Gs, Gq, and G12 minigenes respectively, which Col3a1 was blocked by Gs and Gq minigenes, Col14a1 was antagonized by Gs and G12 minigenes, and Fos was inhibited by all three G protein minigenes. Finally, the PTH-induced decrease of Hk2 was not affected by any of the minigenes. As was the case with the UMR-106 cells, it is worth noting that none of the minigenes had marked effects in the absence of PTH. The results indicated that G protein interactions with PTH1R and subsequent signaling pathways appear consistent between ROS 17/2.8 and UMR-106 osteoblast cell lines.
Figure 2.
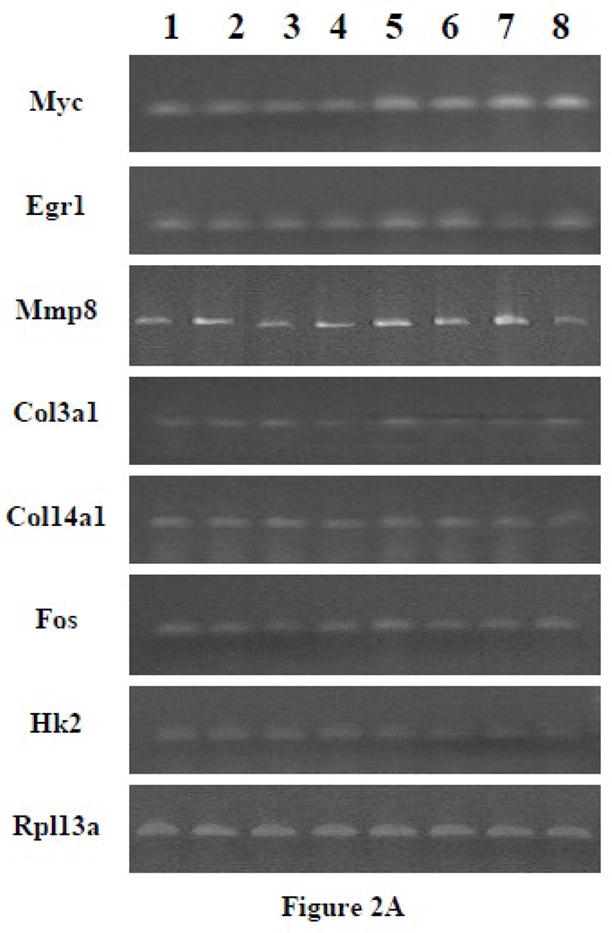
(A) RT-PCR of the effects of PTH on representative genes affected by different G protein minigenes in ROS 17/2.8 cells. The cells were transfected with G protein minigenes or empty vector (pcDNA), and then were treated with PTH (10 nM) for 24 hr. Lane 1, pcDNA transfected; Lane 2, Gs minigene transfected; Lane 3, Gq mingene transfected; Lane 4, G12 minigene transfected; Lane 5, pcDNA transfected + PTH; Lane 6, Gs minigene transfected + PTH; Lane 7, Gq mingene transfected + PTH; Lane 8, G12 minigene transfected + PTH. (B) The relative expression levels of genes were analyzed and normalized against the housekeeping gene Rpl13a. The bands shown in Figure 2A were scanned and quantified for the analysis.
3.1.5 Effects of minigenes on the PTH-responsive genes over a range of time points
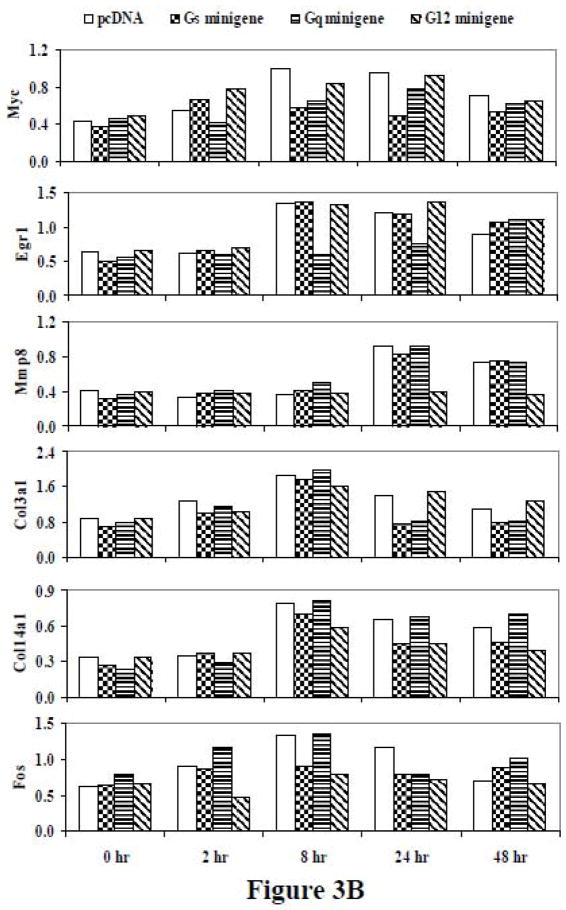
More extensive time course studies were carried out on the representative genes examined in the studies shown in Figure 1. UMR-106 cells were treated with 10 nM PTH for 2, 8, 24, or 48 hr (Figure 3). Although there were differences in the regulation of gene expression by the minigenes at different time points, the regulation by a specific G protein was always consistent with the results observed previously. Of those genes uniquely regulated through a single G protein pathway, Myc was selectively antagonized by the Gs minigene at 8, 24, and 48 hr. PTH-mediated upregulation of Myc gene expression did appear to be regulated by Gq at the 2 hr time point. This finding was confirmed in a replicate analysis (data not shown). Egr1 was selectively antagonized by the Gq minigene at the 8 and 24 hr time points, but was not affected at the 2 and 48 hr time points. Mmp8 was selectively antagonized by the G12 minigene at 24 and 48 hr, while no inhibition was seen at the 2 hr or 8 hr time points. Although the PTH effect on Col3a1 at 8 hr was the largest effect noted by any of the genes at any time point, there was not a clear minigene effect on the response at that time point. The inhibition by Gs and Gq minigenes on Col3a1 gene expression was noted for both the 24 hr and 48 hr time points. The selective effect of Gs and G12 minigenes on Col14a1 was clear at 24 and 48 hr, with effects detectable at 8 hr as well. In the case of Fos, we found that at 24 hr, PTH-stimulated Fos expression was antagonized by all three minigenes, reproducing our previous experimental findings. However, at 2 hr, inhibition of Fos gene expression was only noted for the G12 minigene, and at 8 hr there was an effect by Gs or G12 minigenes, but not with the Gq minigene. Hk2 was not affected by any of the minigenes at any of the time points examined. Thus, the findings at 24 hr appear to reflect a pattern that was largely consistent over a period of time.
Figure 3.
(A) RT-PCR of the time course of effects of PTH on representative genes affected by G protein minigenes in UMR-106 cells. The cells were transfected with pcDNA, Gs minigene, Gq minigene, or G12 minigene, and then treated with 10nM PTH for 0 hr, 2 hr, 8 hr, 24 hr, or 48 hr. (B) The relative expression levels of genes were analyzed and normalized against the housekeeping gene Rpl13a. The bands shown in Figure 3A were scanned and quantified for the analysis.
3.1.6 Effects of downstream signaling inhibitors of the Gs, Gq and G12 pathways on the PTH-responsive genes
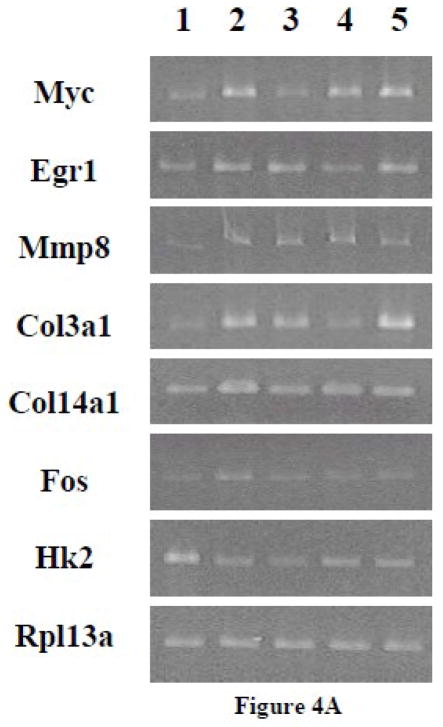
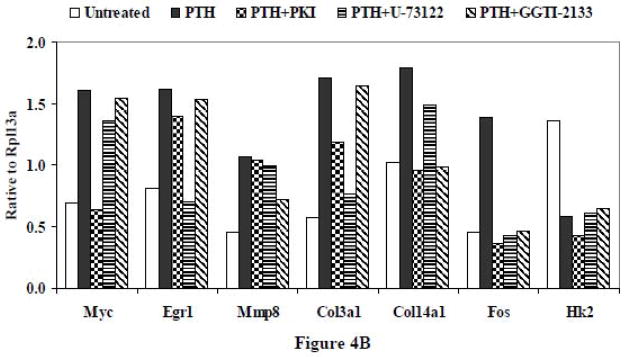
Pharmacological downstream inhibitors of the three pathways were used to validate the effects noted with minigene transfection on the 7 selected genes shown in Figures 1–3 (Figure 4). UMR-106 cells were treated for 24 hr with 10 nM PTH alone or in the presence of inhibitors. The PKA inhibitor PKI (10 μM) was used to validate the effects of the Gs minigene, the PLC inhibitor U73122 (4 μM) was used to validate the effects of the Gq minigene, and the geranylgeranyl transferase I inhibitor GGTI-2133 (30 μM) to validate the effects of the G12 minigene. We found that the effects of the downstream inhibitors mimicked those observed with the minigenes, with PKI inhibiting PTH-mediated increased Myc gene expression, U73122 blocking PTH-mediated increased Egr1 gene expression, and GGTI-2133 reducing PTH-mediated increased Mmp8 gene expression. We also observed that the PTH effect on Col3a1 was blocked by both PKI and U73122, the PTH effect on Col14a1 was antagonized by both PKI and GGTI-2133, and the PTH effect to increase Fos gene expression was inhibited by all three compounds. As was noted with the minigenes, the PTH-induced decrease of Hk2 was not affected by either PKI, U73122, or GGTI-2133. Thus, the findings with the pharmacological downstream inhibitors were consistent with our results obtained following transfection of the minigenes.
Figure 4.
(A) RT-PCR following treatment with pharmacological downstream inhibitors of signaling pathways mediated by Gs, Gq and G12. UMR-106 cells were treated simultaneously with PTH (10 nM) and the PKA inhibitor PKI (10 μM), the PLC inhibitor U73122 (4 μM) or the geranylgeranyltransferase I inhibitor GGTI-2133 (30 μM) for 24 hr. Lane 1. No treatment; Lane 2. PTH; Lane 3. PTH + PKI; Lane 4. PTH + U-73122; Lane 5. PTH + GGTI-2133. (B) The relative expression levels of genes were analyzed and normalized against the housekeeping gene Rpl13a. The bands shown in Figure 4A were scanned and quantified for the analysis.
4.1 Discussion
The current studies have used a novel approach, treatment with Gα C-terminal minigene vectors to selectively inhibit PTH signaling through Gs, Gq and G12, in an effort to obtain further insight into the roles of specific G proteins in PTH-mediated gene expression. The results support the concept that activation of different signaling pathways initiated at the level of the G protein could result in distinct responses to PTH in osteoblasts. In addition, our resuts suggest that it is not uncommon for multiple G proteins to be involved in the effect of the hormone on a single gene.
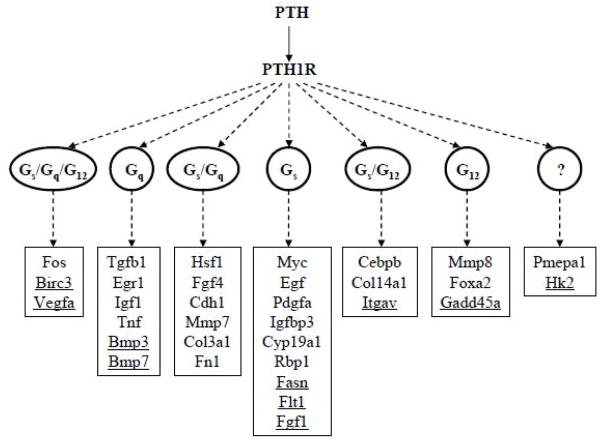
As depicted in Figure 5, PTH regulated 32 of the 159 genes examined. Some PTH- regulated genes were exclusively antagonized through one class of G protein, indicating that there may be absolute specificity at the G protein level for some downstream responses. Other genes were regulated through multiple G proteins, with some genes being regulated through Gs and Gq pathways, others Gs and G12 pathways, and some through Gs, Gq and G12 pathways. That two or more G proteins can control expression of a common gene suggests that crosstalk may occur between different G protein-mediated pathways. Taken together, the results provide evidence for the involvement of multiple signaling pathways and show a role for all three G proteins tested (Gs, Gq, G12) in PTH action. Although we did not find any common genes regulated through Gq and G12 pathways, pathways often linked in their signaling responses [20], such genes could exist, as only a limited number of genes were examined. It is also notable that we identified two PTH-regulated genes that were not affected by any of the G protein minigenes that we tested. This suggests that some PTH effects in osteoblastic cells might be mediated through alternative G proteins [21] or could be completely independent of G protein signaling such as effects mediated through beta-arrestin [22].
Figure 5.
Diagram of gene regulation by PTH signaling mediated through different G proteins (Gs, Gq, G12). The combination of G proteins (Gs/Gq, Gs/G12, Gs/Gq/G12) shows possible crosstalk between different pathways and their downstream genes. The question mark (?) indicates that the mediator of signaling is unknown. The underlined genes were down-regulated by PTH.
A small subset of genes was selected from the 32 affected genes for more in-depth studies. The subset (Myc, Egr1, Mmp8, Col3a1, Col14a1 and Fos) included genes regulated either through individual G proteins (Myc, Egr1, Mmp8) or by multiple G proteins (Col3a1, Col14a1, Fos). Analyses of the time course response of these genes showed that the 24 hr time point was not the only time at which effects of the minigenes could be observed; the inhibition of PTH effects by specific minigenes observed at the 24 hr time point was often noted at the other time points examined. One exception that we observed was an apparent regulation of Myc at 2 hr through Gq, at 8 hr by both Gq and Gs minigenes, and at 24 and 48 hr by only the Gs minigene. There also appeared to be some time-dependent differences in the G protein regulation of Fos, which was down-regulated earlier and longer by the G12 minigene. The finding that multiple minigenes are involved in PTH regulation of Fos at the 24 hr time point is noteworthy in view of the evidence that Fos expression at time points earlier than 2 hr is dependent on PKA and independent of PKC [23, 24]. The later PKC-dependent response that we observed could be a secondary effect reflecting a signaling cascade. The current findings reveal that early expression of Fos may be regulated through G12 signaling and that signaling through G12 is sustained. It is perhaps not surprising that Fos could be regulated through multiple signaling pathways, as Fos is critical for the differentiation of osteoblasts [25] and in vivo studies have shown impairment of PTH-induced osteoblast differentiation in association with a decrease in c-Fos mRNA [26]. Other work has revealed that c-Fos is also relevant to osteoclasts and thus may have a crucial role in bone formation in response to PTH [27, 28].
Using the same small subset of genes, the antagonism shown with the G protein minigenes was validated with pharmacological downstream inhibitors. PKI, an inhibitor of PKA, U73122, an inhibitor of PLC and GGTI-2133, which inhibits the geranylgeranylation of RhoA [29], a downstream effector of G12 signaling in UMR-106 cells [9], mimicked the effects of the of the Gs, Gq and G12 minigenes. Additionally, PTH-mediated G protein signaling appeared to be consistent between UMR-106 cells and another osteoblast cell line, ROS 17/2.8, indicating the applicability of this novel approach to dissect out relevant G protein signaling pathways on PTH-mediated gene expression.
Studies of PTH signaling have largely focused on Gs, and the clinical relevance of this G protein in bone pathophysiology has been established. Mutations in Gs that lead to constitutive activation are present in fibrous dysplasia of bone and McCune-Albright syndrome, while loss-of-function mutations lead to Albright hereditary osteodystrophy. However, some important PTH-regulated genes may be regulated through other G proteins. The involvement of multiple G proteins in the response to agonists is characteristic of class II G protein coupled receptors, of which the PTH1R is a member [30]. Yet, the evidence for PTH-mediated signaling via diverse G proteins, as well as crosstalk occurring between Gα signaling pathways, has previously been obtained from indirect approaches including the use of inhibitors and activators of downstream effectors such as adenylyl cyclase, PKA and PKC. As an example of crosstalk, PTH activation of PLC (a Gq/11-mediated event) was enhanced when cells were treated with the PKA inhibitor H-89 [31] presumably working downstream of Gs. PTH fragments have also been useful in not ony highlighting the ability of the PTH1R to signal multiple G proteins, but also in dissecting the pathways. For example, Li et al [32] found that PTH 3–34, which does not increase cAMP (unless very high concentrations are used) regulated very few genes, consistent with the concept that cAMP signaling through Gs is the major pathway for PTH actions on bone. However, PTH(3–34), like PTH(1–34), was found to increase IGFBP5 mRNA, suggesting that there could be dual regulation of this important regulatory protein which may potentiate anabolic effects of PTH. Wu and Kumar [6] utilized the PTH(29–32) fragment, which activates PKC but not PKA, to show that the TGFβ1 isoform, but not TGFβ2, is regulated by a PKC-dependent pathway. They used agonists and antagonists selective for PKA or PKC to demonstrate that the Gs-cAMP-PKA pathway is involved in PTH-mediated activation of the TGFβ2 isoform. Agents that act more proximal to PTH1R, such as the G protein selective minigenes used in the current studies, will help to definitively establish the contributions of a given G protein(s) in PTH actions.
The present findings on PTH effects on gene expression in UMR-106 cells can be compared with the previous studies by Qin et al. [2], in which UMR-106 cells were treated with PTH(1–34) at 10−8M for 4, 12 or 24 hr, and gene expression profiles examined using a hybridization-based microarray. Out of the 8799 transcripts examined, 125 genes were found to be regulated by PTH treatment. Among the 32 genes regulated by a 24 hour PTH treatment in our studies, ten genes were shown to be regulated by PTH in their study, including Bmp3 (12 hr), Bmp7 (24 hr), Fos (4 hr, 12 hr), Cebpb (4 hr), Gadd45a (12 hr), Rbp1 (4 hr, 12 hr), Hk2 (24 hr), Col3a1 (24 hr), Fn1 (24 hr), and Myc (4 hr). Qin et al. also found several additional genes regulated by PTH after 4 hr treatment, including Bmp4, Vegfb, and Ccnd1. Although these genes were on our array, we did not find significant changes in their expression after PTH treatment for 24 hr. A number of other microarray studies have examined effects of PTH on gene expression in bone or bone cells, however because of the models used or the gene sets examined, the results were not directly comparable to the present work [33–36].
5.1 Conclusions
5.1.1
The study has used a novel approach, transfection of antagonist minigenes specifically targeting selected G proteins, to provide insights into the roles of these proteins in PTH-mediated gene expression.
5.1.2
The findings indicate that there are responses that appear to be selectively controlled by a single G protein, and responses resulting from co-regulation or sequential regulation, suggesting crosstalk between G proteins, as well as responses that may be G protein independent.
5.1.3
The studies raise interesting possibilities for the dynamic regulation of PTH responses at the G protein level. Such diversity in response may be the result of ligand-induced changes in the conformational state of the receptor [37], consistent with biased signaling by fragments and analogs of parathyroid hormone.
5.1.4
Given that PTH promotes both anabolic and catabolic effects, determining the role for each of the G proteins will assist researchers as they endeavor to design drugs that selectively activate specific downstream signaling pathways which provide therapeutic potential while minimizing unwanted side effects.
Acknowledgments
This study was supported by a grant from the National Institutes of Health (R01-AR 11262) to Dr. Stern. Dr. Peter Friedman kindly provided the ROS 17/2.8 cells.
Footnotes
Publisher's Disclaimer: This is a PDF file of an unedited manuscript that has been accepted for publication. As a service to our customers we are providing this early version of the manuscript. The manuscript will undergo copyediting, typesetting, and review of the resulting proof before it is published in its final citable form. Please note that during the production process errors may be discovered which could affect the content, and all legal disclaimers that apply to the journal pertain.
Contributor Information
J. Wang, Email: j-wang4@northwestern.edu.
A. Gilchrist, Email: agilch@midwestern.edu.
P.H. Stern, Email: p-stern@northwestern.edu.
7.1 References
- 1.Hock JM, Fitzpatrick LA, Bilezikian JB. In: Principles of Bone Biology. 2. Bilezikian JP, Raisz LG, Rodan GA, editors. Academic Press; San Diego: 2002. pp. 463–481. [Google Scholar]
- 2.Qin L, Qiu P, Wang L, Li X, Swarthout JT, Soteropoulos P, Tolias P, Partridge NC. J Biol Chem. 2003;278:19723–19731. doi: 10.1074/jbc.M212226200. [DOI] [PubMed] [Google Scholar]
- 3.Yang D, Singh R, Divieti P, Guo J, Bouxsein ML, Bringhurst FR. Bone. 2007;40:1453–1461. doi: 10.1016/j.bone.2007.02.001. [DOI] [PMC free article] [PubMed] [Google Scholar]
- 4.Ferrandon S, Feinstein TN, Castro M, Wang B, Bouley R, Potts JT, Gardella TJ, Vilardaga JP. Nat Chem Biol. 2009;5:734–742. doi: 10.1038/nchembio.206. [DOI] [PMC free article] [PubMed] [Google Scholar]
- 5.Erclik MS, Mitchell J. Am J Physiol Endocrinol Metab. 2002;282:E534–541. doi: 10.1152/ajpendo.00417.2001. [DOI] [PubMed] [Google Scholar]
- 6.Wu Y, Kumar R. J Bone Miner Res. 2000;15:879–884. doi: 10.1359/jbmr.2000.15.5.879. [DOI] [PubMed] [Google Scholar]
- 7.Swarthout JT, Doggett TA, Lemker JL, Partridge NC. J Biol Chem. 2001;276:7586–7592. doi: 10.1074/jbc.M007400200. [DOI] [PubMed] [Google Scholar]
- 8.Singh AT, Bhattacharyya RS, Radeff JM, Stern PH. J Bone Miner Res. 2003;18:1453–1460. doi: 10.1359/jbmr.2003.18.8.1453. [DOI] [PubMed] [Google Scholar]
- 9.Singh AT, Gilchrist A, Voyno-Yasenetskaya T, Radeff-Huang JM, Stern PH. Endocrinology. 2005;146:2171–2175. doi: 10.1210/en.2004-1283. [DOI] [PubMed] [Google Scholar]
- 10.Radeff JM, Singh AT, Stern PH. Cell Signal. 2004;16:105–114. doi: 10.1016/s0898-6568(03)00131-1. [DOI] [PubMed] [Google Scholar]
- 11.Radeff JM, Nagy Z, Stern PH. J Bone Miner Res. 2004;19:1882–1891. doi: 10.1359/JBMR.040806. [DOI] [PubMed] [Google Scholar]
- 12.Kazmers NH, Ma SA, Yoshida T, Stern PH. Bone. 2009;45:52–60. doi: 10.1016/j.bone.2009.03.675. [DOI] [PMC free article] [PubMed] [Google Scholar]
- 13.Yoshida T, Clark MF, Stern PH. J Cell Biochem. 2009;106:896–902. doi: 10.1002/jcb.22059. [DOI] [PMC free article] [PubMed] [Google Scholar]
- 14.Gilchrist A, Bunemann M, Li A, Hosey MM, Hamm HE. J Biol Chem. 1999;274:6610–6616. doi: 10.1074/jbc.274.10.6610. [DOI] [PubMed] [Google Scholar]
- 15.Gilchrist A, Li A, Hamm HE. Sci STKE. 2002;118:PL1. doi: 10.1126/stke.2002.118.pl1. [DOI] [PubMed] [Google Scholar]
- 16.Zhang L, Bastepe M, Juppner H, Ruan KH. Arch Biochem Biophys. 2006;454:80–88. doi: 10.1016/j.abb.2006.06.023. [DOI] [PubMed] [Google Scholar]
- 17.Yang YM, Lee S, Nam CW, Ha JH, Jayaraman M, Dhanasekaran DN, Lee CH, Kwak MK, Kim SG. Carcinogenesis. 2010;31:1230–1237. doi: 10.1093/carcin/bgq097. [DOI] [PubMed] [Google Scholar]
- 18.Gilchrist A, Vanhauwe JF, Li A, Thomas TO, Voyno-Yasenetskaya T, Hamm HE. J Biol Chem. 2001;276:25672–25679. doi: 10.1074/jbc.M100914200. [DOI] [PubMed] [Google Scholar]
- 19.Deng X, Mercer PF, Scotton CJ, Gilchrist A, Chambers RC. Mol Biol Cell. 2008;19:2520–2533. doi: 10.1091/mbc.E07-07-0720. [DOI] [PMC free article] [PubMed] [Google Scholar]
- 20.Riobo NA, Manning DR. Trends Pharmacol Sci. 2005;26:146–154. doi: 10.1016/j.tips.2005.01.007. [DOI] [PubMed] [Google Scholar]
- 21.Mahon MJ, Bonacci TM, Divieti P, Smrcka AV. Mol Endocrinol. 2006;20:136–146. doi: 10.1210/me.2005-0169. [DOI] [PubMed] [Google Scholar]
- 22.Gesty-Palmer D, Chen M, Reiter E, Ahn S, Nelson CD, Wang S, Eckhardt AE, Cowan CL, Spurney RF, Luttrell LM, Lefkowitz RJ. J Biol Chem. 2006;281:10856–10864. doi: 10.1074/jbc.M513380200. [DOI] [PubMed] [Google Scholar]
- 23.Clohisy JC, Scott DK, Brakenhoff KD, Quinn CO, Partridge NC. Mol Endocrinol. 1992;6:1834–1842. doi: 10.1210/mend.6.11.1480173. [DOI] [PubMed] [Google Scholar]
- 24.McCauley LK, Koh AJ, Beecher CA, Rosol TJ. Endocrinology. 1997;138:5427–5433. doi: 10.1210/endo.138.12.5587. [DOI] [PubMed] [Google Scholar]
- 25.Grigoriadis AE, Wang ZQ, Wagner EF. Trends Genet. 1995;11:436–441. doi: 10.1016/s0168-9525(00)89142-8. [DOI] [PubMed] [Google Scholar]
- 26.Tanaka S, Sakai A, Tanaka M, Otomo H, Okimoto N, Sakata T, Nakamura T. J Bone Miner Res. 2004;19:1813–1820. doi: 10.1359/JBMR.040808. [DOI] [PubMed] [Google Scholar]
- 27.Luiz de Freitas PH, Li M, Ninomiya T, Nakamura M, Ubaidus S, Oda K, Udagawa N, Maeda T, Takagi R, Amizuka N. J Bone Miner Res. 2009;24:1586–1597. doi: 10.1359/jbmr.090413. [DOI] [PubMed] [Google Scholar]
- 28.Koh AJ, Demiralp B, Neiva KG, Hooten J, Nohutcu RM, Shim H, Datta NS, Taichman RS, McCauley LK. Endocrinology. 2005;146:4584–4596. doi: 10.1210/en.2005-0333. [DOI] [PubMed] [Google Scholar]
- 29.Laufs U, Liao J. J Biol Chem. 1998;273:24266–24271. doi: 10.1074/jbc.273.37.24266. [DOI] [PubMed] [Google Scholar]
- 30.Abou-Samra AB, Juppner H, Force T, Freeman MW, Kong XF, Schipani E, Urena P, Richards J, Bonventre JV, Potts JT, Jr, Kronenberg HM, Segre GV. Proc Natl Acad Sci U S A. 1992;89:2732–2736. doi: 10.1073/pnas.89.7.2732. [DOI] [PMC free article] [PubMed] [Google Scholar]
- 31.Tawfeek HA, Abou-Samra AB. Endocrinology. 2008;149:4016–4023. doi: 10.1210/en.2007-1375. [DOI] [PMC free article] [PubMed] [Google Scholar]
- 32.Li X, Liu H, Qin L, Tamasi J, Bergenstock M, Shapses S, Feyen JH, Notterman DA, Partridge NC. J Biol Chem. 2007;282:33086–33097. doi: 10.1074/jbc.M705194200. [DOI] [PubMed] [Google Scholar]
- 33.Onyia JE, Helvering LM, Gelbert L, Wei T, Huang S, Chen P, Dow ER, Maran A, Zhang M, Lotinun S, Lin X, Halladay DL, Miles RR, Kulkarni NH, Ambrose EM, Ma YL, Frolik CA, Sato M, Bryant HU, Turner RT. J Cell Biochem. 2005;95:403–418. doi: 10.1002/jcb.20438. [DOI] [PubMed] [Google Scholar]
- 34.Kulkarni NH, Wei T, Kumar A, Dow ER, Stewart TR, Shou J, N’Cho M, Sterchi DL, Gitter BD, Higgs RE, Halladay DL, Engler TA, Martin TJ, Bryant HU, Ma YL, Onyia JE. J Cell Biochem. 2007;102:1504–1518. doi: 10.1002/jcb.21374. [DOI] [PubMed] [Google Scholar]
- 35.Allan EH, Hausler KD, Wei T, Gooi JH, Quinn JM, Crimeen-Irwin B, Pompolo S, Sims NA, Gillespie MT, Onyia JE, Martin TJ. J Bone Miner Res. 2008;23:1170–1181. doi: 10.1359/jbmr.080324. [DOI] [PubMed] [Google Scholar]
- 36.Onan D, Allan EH, Quinn JM, Gooi JH, Pompolo S, Sims NA, Gillespie MT, Martin TJ. Endocrinology. 2009;150:2244–2253. doi: 10.1210/en.2008-1597. [DOI] [PubMed] [Google Scholar]
- 37.Gilchrist A. Trends Pharmacol Sci. 2007;28:431–437. doi: 10.1016/j.tips.2007.06.012. [DOI] [PubMed] [Google Scholar]


