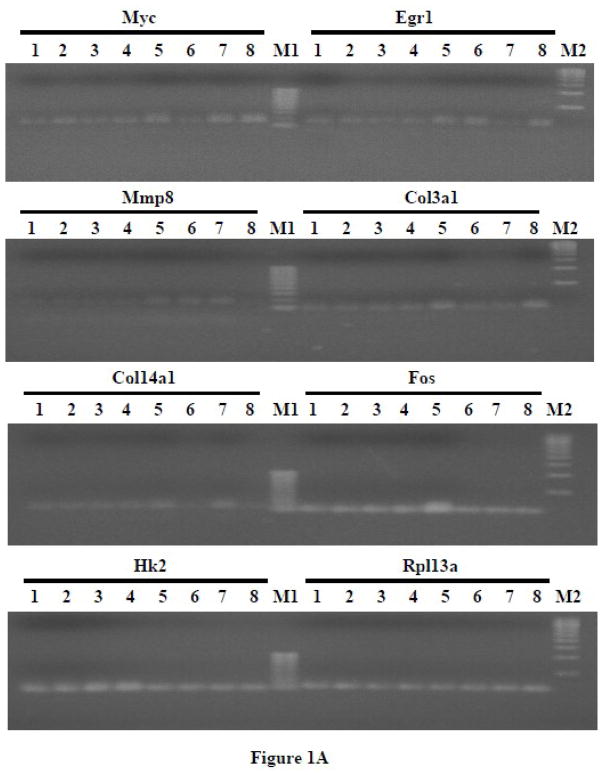
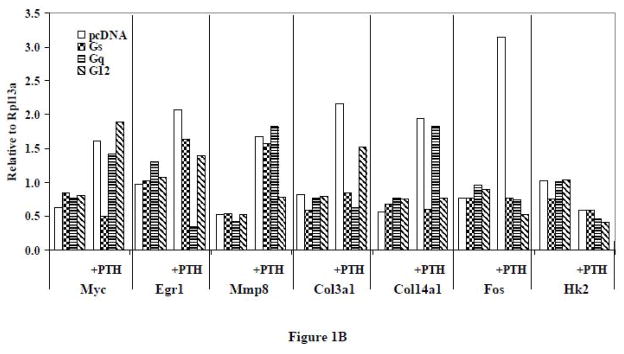
Figure 1.
(A) RT-PCR of representative genes that were regulated by PTH and affected by different G protein minigenes in UMR-106 cells. The cells were transfected with G protein minigenes or empty vector (pcDNA), and then were treated with PTH (10 nM) for 24 hr. Lane 1, pcDNA transfected; Lane 2, Gs minigene transfected; Lane 3, Gq mingene transfected; Lane 4, G12 minigene transfected; Lane 5, pcDNA transfected + PTH; Lane 6, Gs minigene transfected + PTH; Lane 7, Gq mingene transfected + PTH; Lane 8, G12 minigene transfected + PTH; M1, 100bp molecular ruler; M2, 500bp molecular ruler. (B) The relative expression levels of genes were analyzed and normalized against the housekeeping gene Rpl13a. The bands shown in Figure 1A were scanned and quantified for the analysis.


