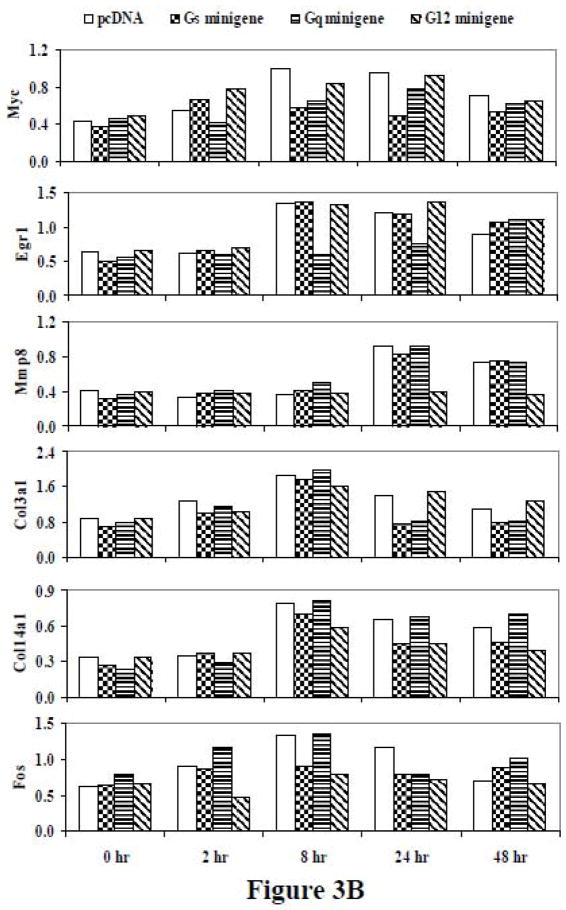
Figure 3.
(A) RT-PCR of the time course of effects of PTH on representative genes affected by G protein minigenes in UMR-106 cells. The cells were transfected with pcDNA, Gs minigene, Gq minigene, or G12 minigene, and then treated with 10nM PTH for 0 hr, 2 hr, 8 hr, 24 hr, or 48 hr. (B) The relative expression levels of genes were analyzed and normalized against the housekeeping gene Rpl13a. The bands shown in Figure 3A were scanned and quantified for the analysis.


